Sustainable Impacts of Walkability 
David Sweere 
Sustainability Capstone Instructor: Dr. Tahar Messadi 
Honors Capstone Committee: Dr. Noah Billig (chair), Prof. Jeff Shannon, Dr. Carl Smith 
06 May 2019 
Sustainability Capstone 
Fay Jones School of Architecture + Design 
University of Arkansas, Fayetteville
1.    INTRODUCTION & ABSTRACT
1.1.    WALKABILITY OF THE AMERICAN SUBURBS
Eighty percent of everything ever built in America has been built in the last fifty years, and most of it is depressing, brutal, ugly, unhealthy, and spiritually degrading - the jive-plastic commuter tract home wastelands, the Potemkin village shopping plazas with their vast parking lagoons, the Lego-block hotel complexes, the ‘gourmet mansardic” junk-food joints, the Orwellian office “parks” featuring buildings sheathed in the same reflective glass as the sunglasses worn by chain meadow and cornfield, the freeway loops around every big and little city with their clusters of discount merchandise marts, the whole destructive, wasteful, toxic, agoraphobia-inducing spectacle that politicians proudly call growth. (Kunstler 10, 1994) 
Most of the United States population lives in the suburbs. In fact, 53 percent of Americans describe the area in which they live suburban (Kolko 2015).  The current structure of suburbs has proven unsustainable in regard to environmental, social or economic outputs. Most contemporary architectural and urban theorists agree that the suburban condition is inherently problematic.  Suburban sprawl has been described as “the greatest misallocation of resources in the history of the world” (Kunstler 2004). “We cannot overestimate the amount of despair we are generating with places like this.” The problematic state of the suburban built condition has caused numerous negative impacts, including dependence on the vehicle, environmental costs, transportation costs, and even increased obesity rates (Dunham-Jones 2010). Because the suburbs comprise the majority of our “urbanized” areas, it is important that designers are able to rectify this American man-made landscape by building public spaces that encourage social investment.
There is evidence that the shifting demographic of the current culture calls for a more urban lifestyle in the suburbs (Dunham-Jones 2010). There must be a re-habitation, re-development, and re-greening of the suburbs that have failed in their pursuits of sustainable human habitation. This project primarily discusses a specific type of re-development known as suburban retrofit; suburban retrofit is the urbanization of a suburban area through the development of walkable built form. 
Walkability has been described as critical to the performance of urban environments, and this project is designed to advocate for walkability. First, a series of infographics describe some of the numerous economic, environmental, and health-related impacts of the current suburban built condition. These issues are exacerbated by the lack walkability of suburban built form. This project also includes a series of infographics which explain the constructs of walkability as described in a previous capstone. These are designed to be powerful and quickly understood by non-experts of urban form in order to advocate for walkable development and the retrofitting of suburbia.

1.2.    WALKABILITY & SUSTAINABILITY 
The walkability of built form has a direct relationship to the sustainability of communities - environmentally, socially, and economically. Walkability creates places that are worth caring about, creates places for social contact, increases productivity, decreases obesity rates, reduces carbon emissions, and numerous other positive impacts on communities. This capstone attempts to relay this important message, directly and powerfully. According to Ellen Dunham Jones, retrofitting suburbia into walkable nodes of community will be design challenge of the next century, incrementally transforming our wide-spread suburbs into places of sustainable human habitation. It is the intent of this capstone to use these presentation graphics as a means of developing a greater understanding of what it means for a place to be walkable. These graphics are meant to be accessible to a wide audience outside of the fields of architecture, urban design, and urban theory.

1.3.    CAPSTONE QUESTION
The capstone seeks to present answers to the following questions: First, what are the sustainable impacts of walkability? And second, what are the constructs of walkability and how can they be diagrammed and illustrated to send a powerful message to non-experts in the field of urban design?

2.    BACKGROUND & INFOGRAPHICS
2.1.    WALKABILITY OF THE AMERICAN SUBURBS
In America, with its superabundance of cheap land, simple property laws, social mobility, mania for profit, zest for practical invention, and Bible-drunk sense of history, the yearning to escape industrialism expressed itself as a renewed search for Eden. America reinvented that paradise, described so briefly and vaguely in the book of Genesis, called it Suburbia, and put it up for sale. (Kunstler 37, 1994)
The American suburb has developed into a monoculture of housing and isolated commercial buildings that has failed to prove its efficacy on environmental, social or economic terms, in which municipal set-back policies, improper division of land, and lack of walkability (among many other aspects) have attributed to a suburban streetscape that is ill-defined and spatially residual (Dunham-Jones, 2010). According to Dunham-Jones there are viable strategies for retrofitting the suburban built environment into a complete, vibrant and sustainable multi-ply places for the future. This capstone diagrams and illustrates a set of constructs to measure and assess walkability. These constructs were synthesized from the writings of urban theorists, designers, and architects in a previous capstone.
Walkability has been described as critical to the performance of urban places. In Retrofitting Suburbia, Ellen Dunham-Jones quotes and discusses recommendations from the Urban Land Institute for “pedestrian-friendly places that encourage interaction” (Dunham-Jones 173, 2009). Describing walkable places as convenient, safe, and interesting, Dunham-Jones sets up a series of factors that contribute to walkability (Dunham-Jones 175, 2009), building on the urban concepts discussed in urban theorist Jane Jacobs’ The Death and Life of Great American Cities. Suburban retrofits require bringing these urban concepts (constructs of walkability) into the suburbs and integrating them into the suburban built fabric. 
 

2.2.    SUSTAINABLE IMPACTS OF WALKABILITY
The walkability of built form has a direct correlation to the sustainability and resiliency of communities - environmentally, socially, and economically. Walkability creates places that are worth caring about, creates places for social contact, increases productivity, decreases obesity rates, reduces carbon emissions, and numerous other positive impacts on communities As part of this capstone, the sustainable impacts of walkability are diagrammed and illustrated into infographics that are meant to be accessible to a wide audience outside the fields of architecture, urban design, and urban theory. The data retrieved for these infographics is synthesized from the writings of experts in the field of walkability and built form. This capstone looks at two impacts of walkability: the average carbon footprint per dwelling unit and the obesity rates of standard suburban built form versus walkable built form. While there are numerous other impacts, the constraints of this capstone allowed for a limited number of impacts to be illustrated. This method of graphically representing the impacts of walkability can be carried forward in future research and advocacy. 

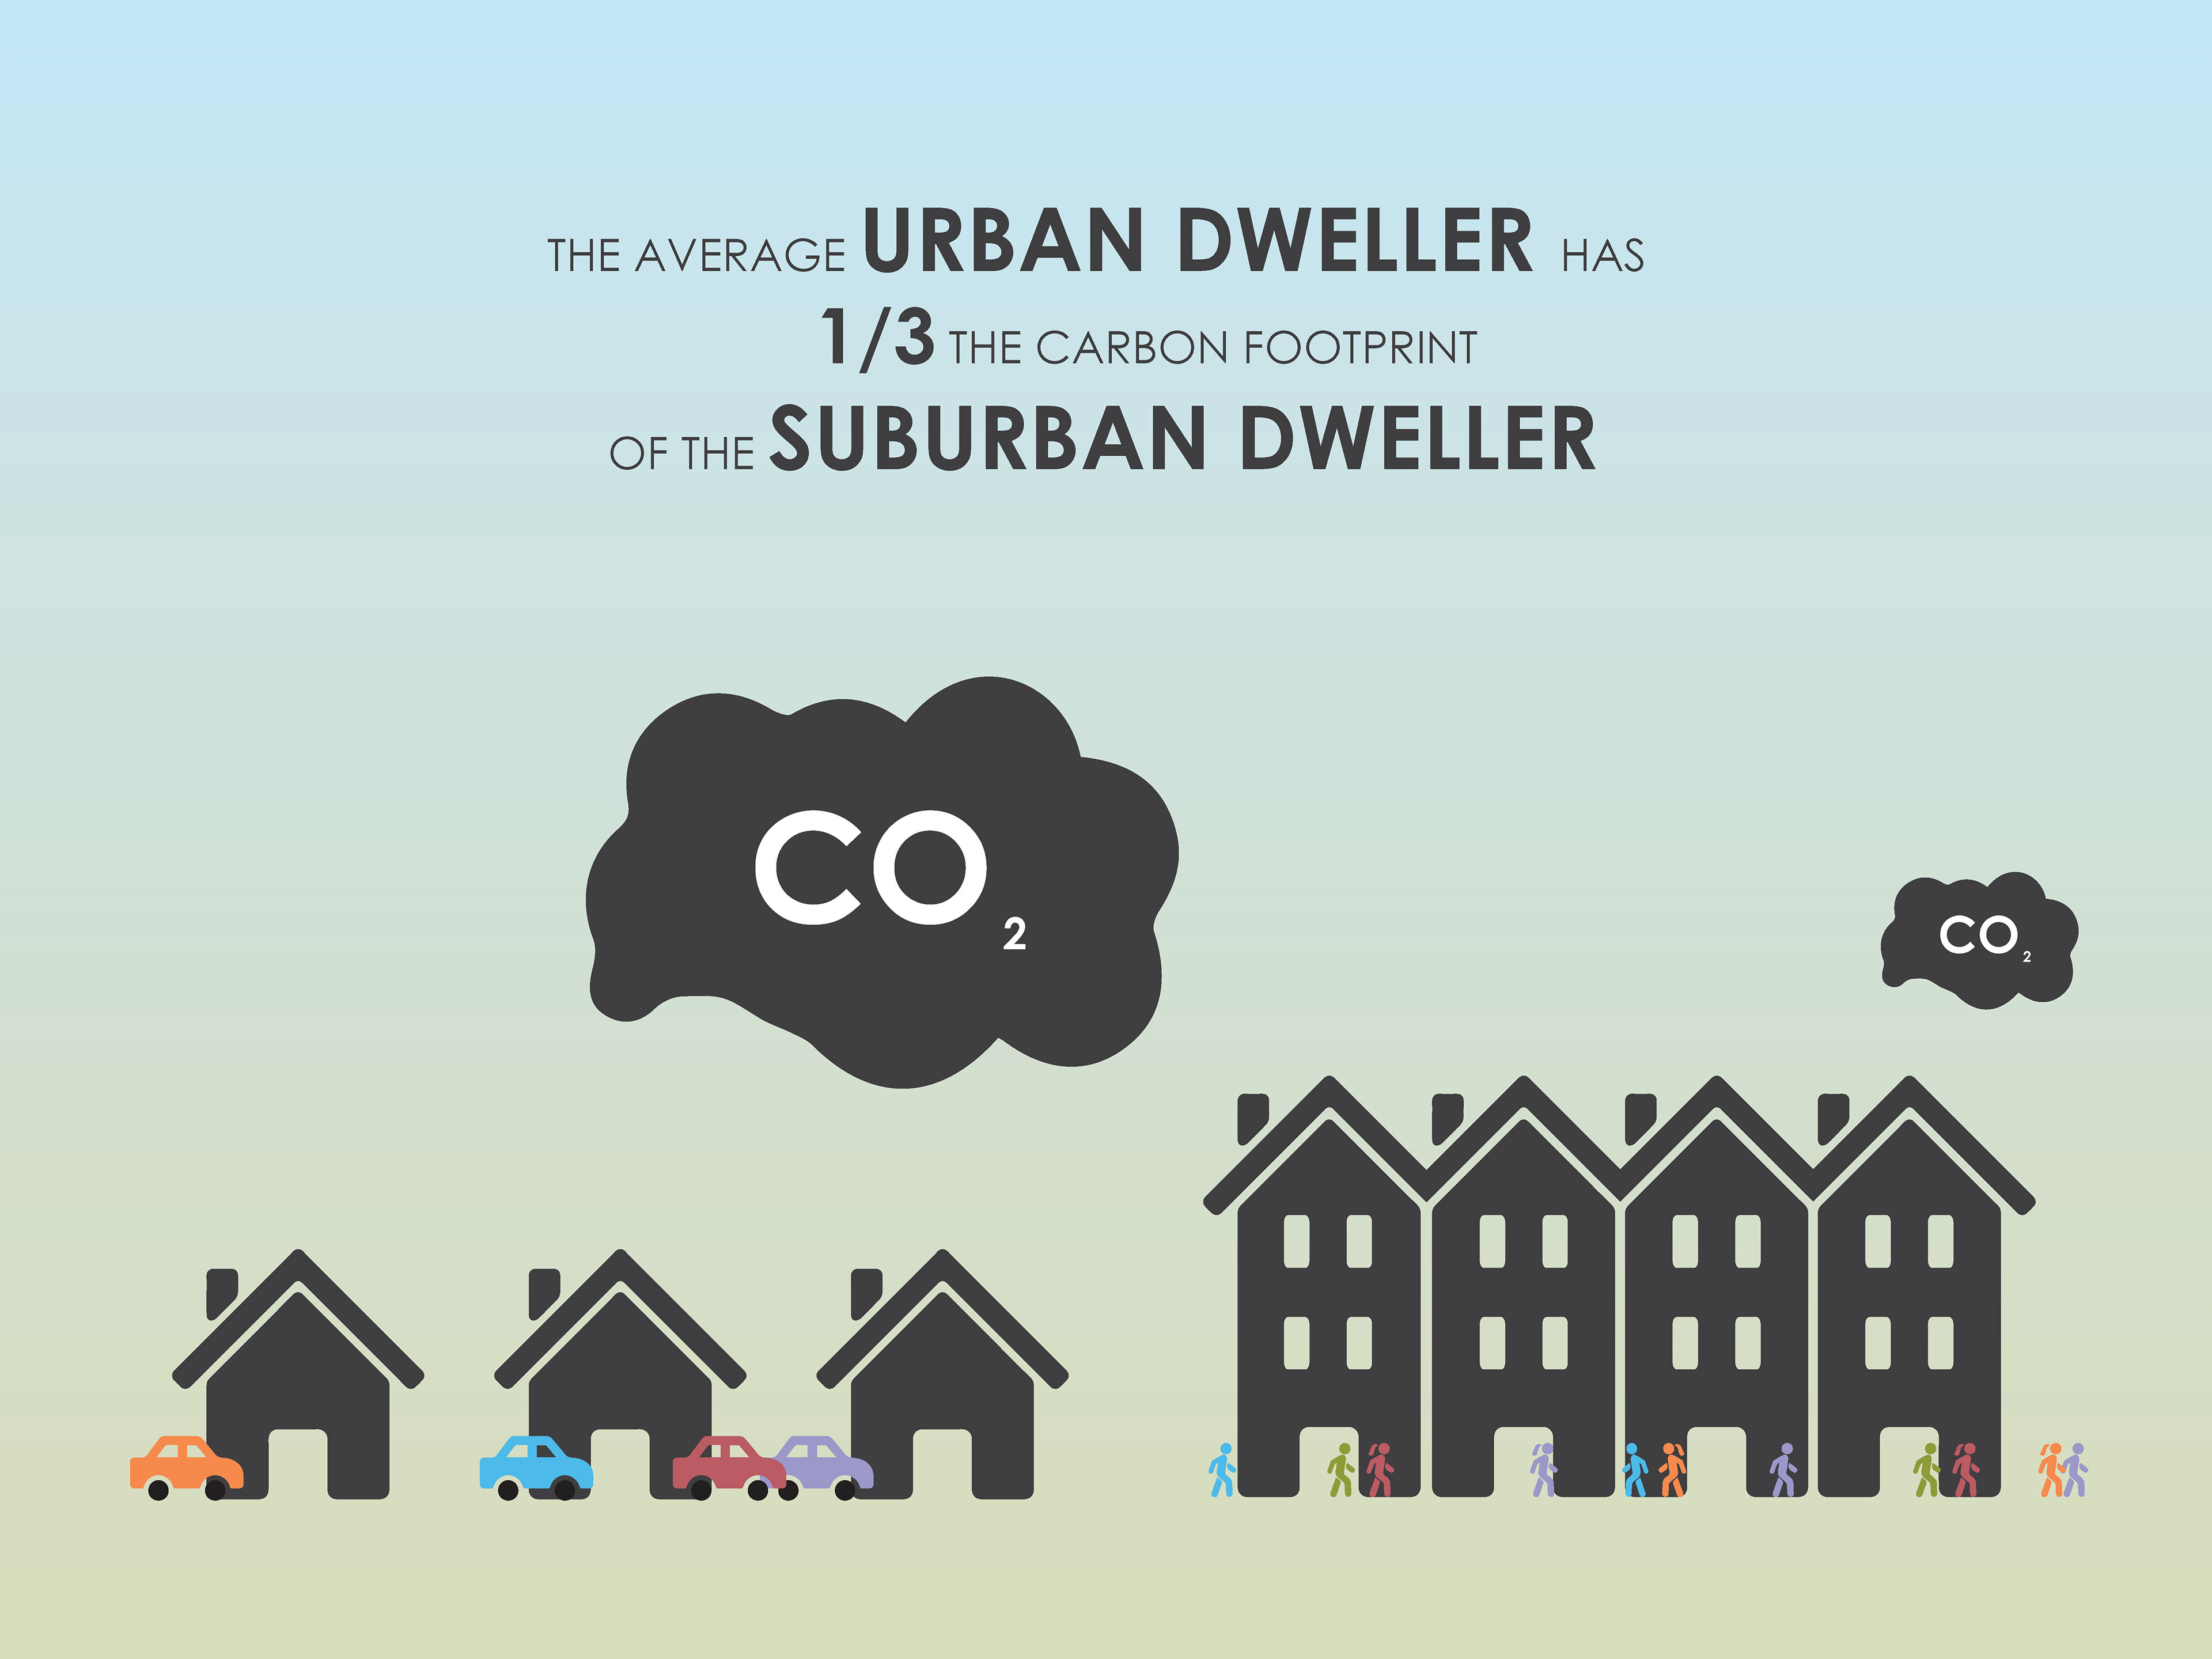
FIGURE 1 - CARBON FOOTPRINT OF URBAN DWELLER VERSUS SUBURBAN DWELLER - Source: (Dunham-Jones, 2010) drawn by author

The above infographic was developed from a statistic presented by Dunham-Jones in a 2010 TED TALK, in which she discusses numerous impacts of the current built condition of the American suburb. On average, the urban dweller’s carbon footprint is a third of the suburban dweller’s carbon footprint. This is due to increased transportation and the need to heat and cool freestanding buildings.

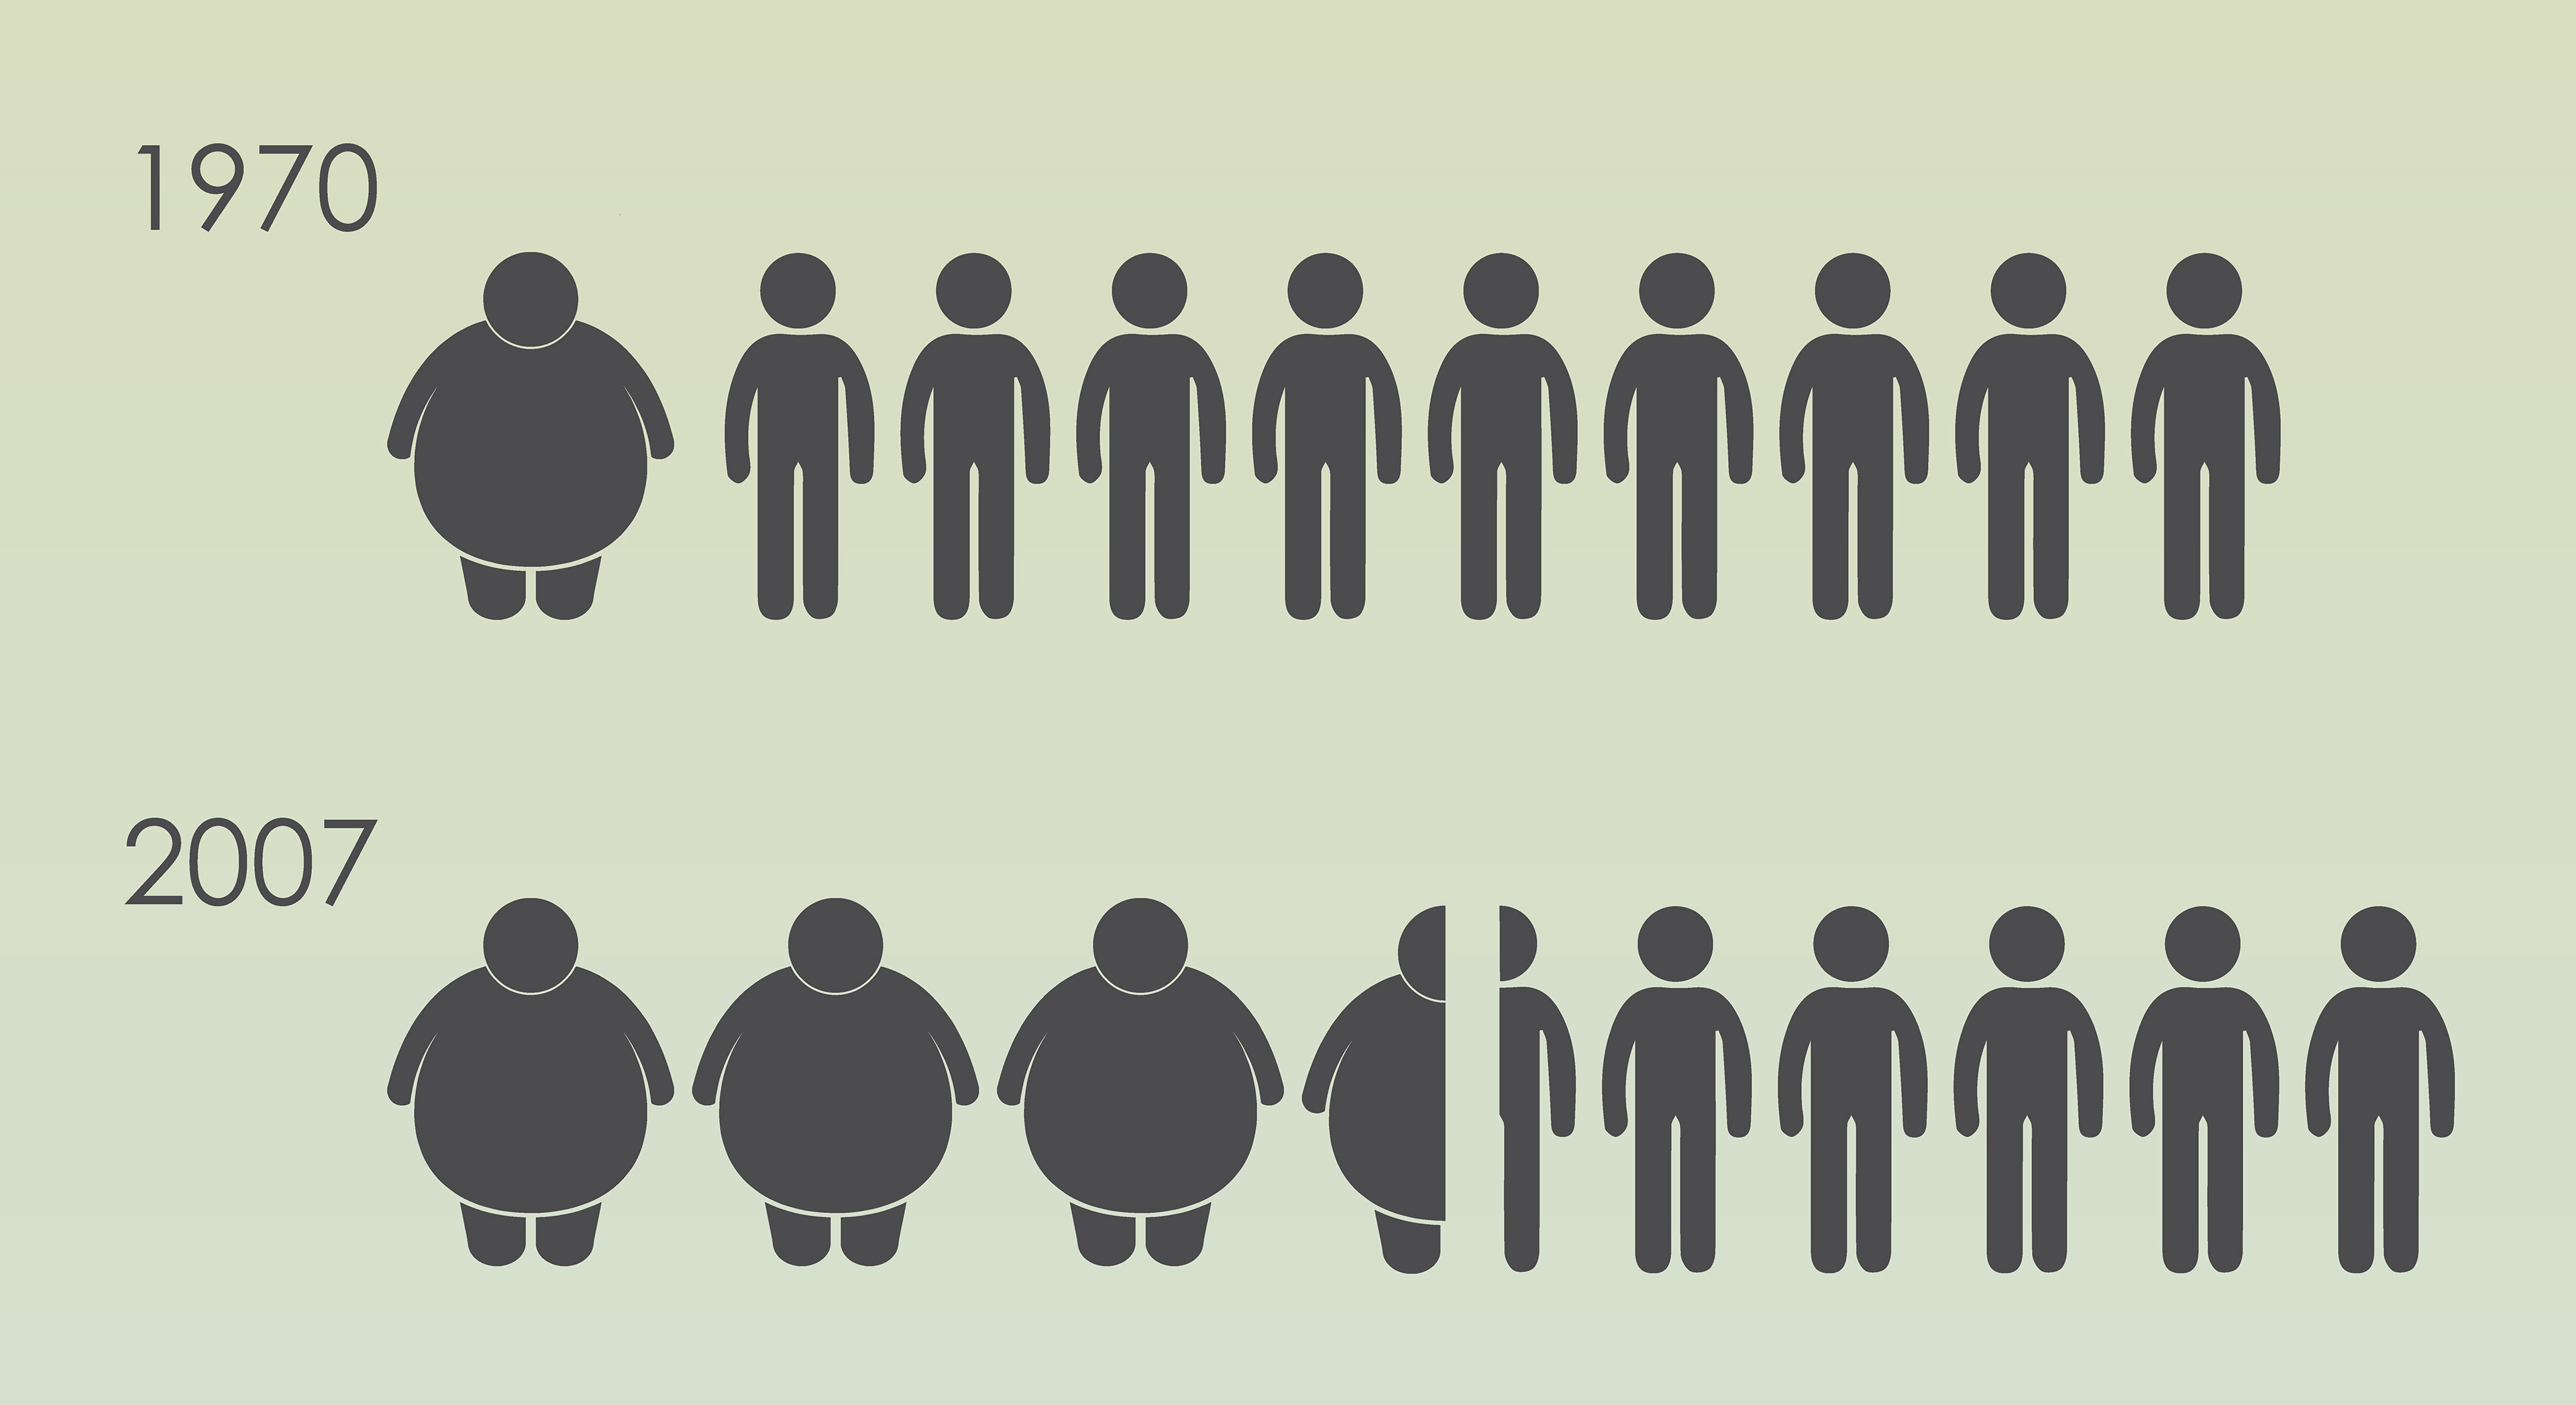
FIGURE 2 - OBESITY RATES IN THE UNITED STATES - Source: (Speck) drawn by author

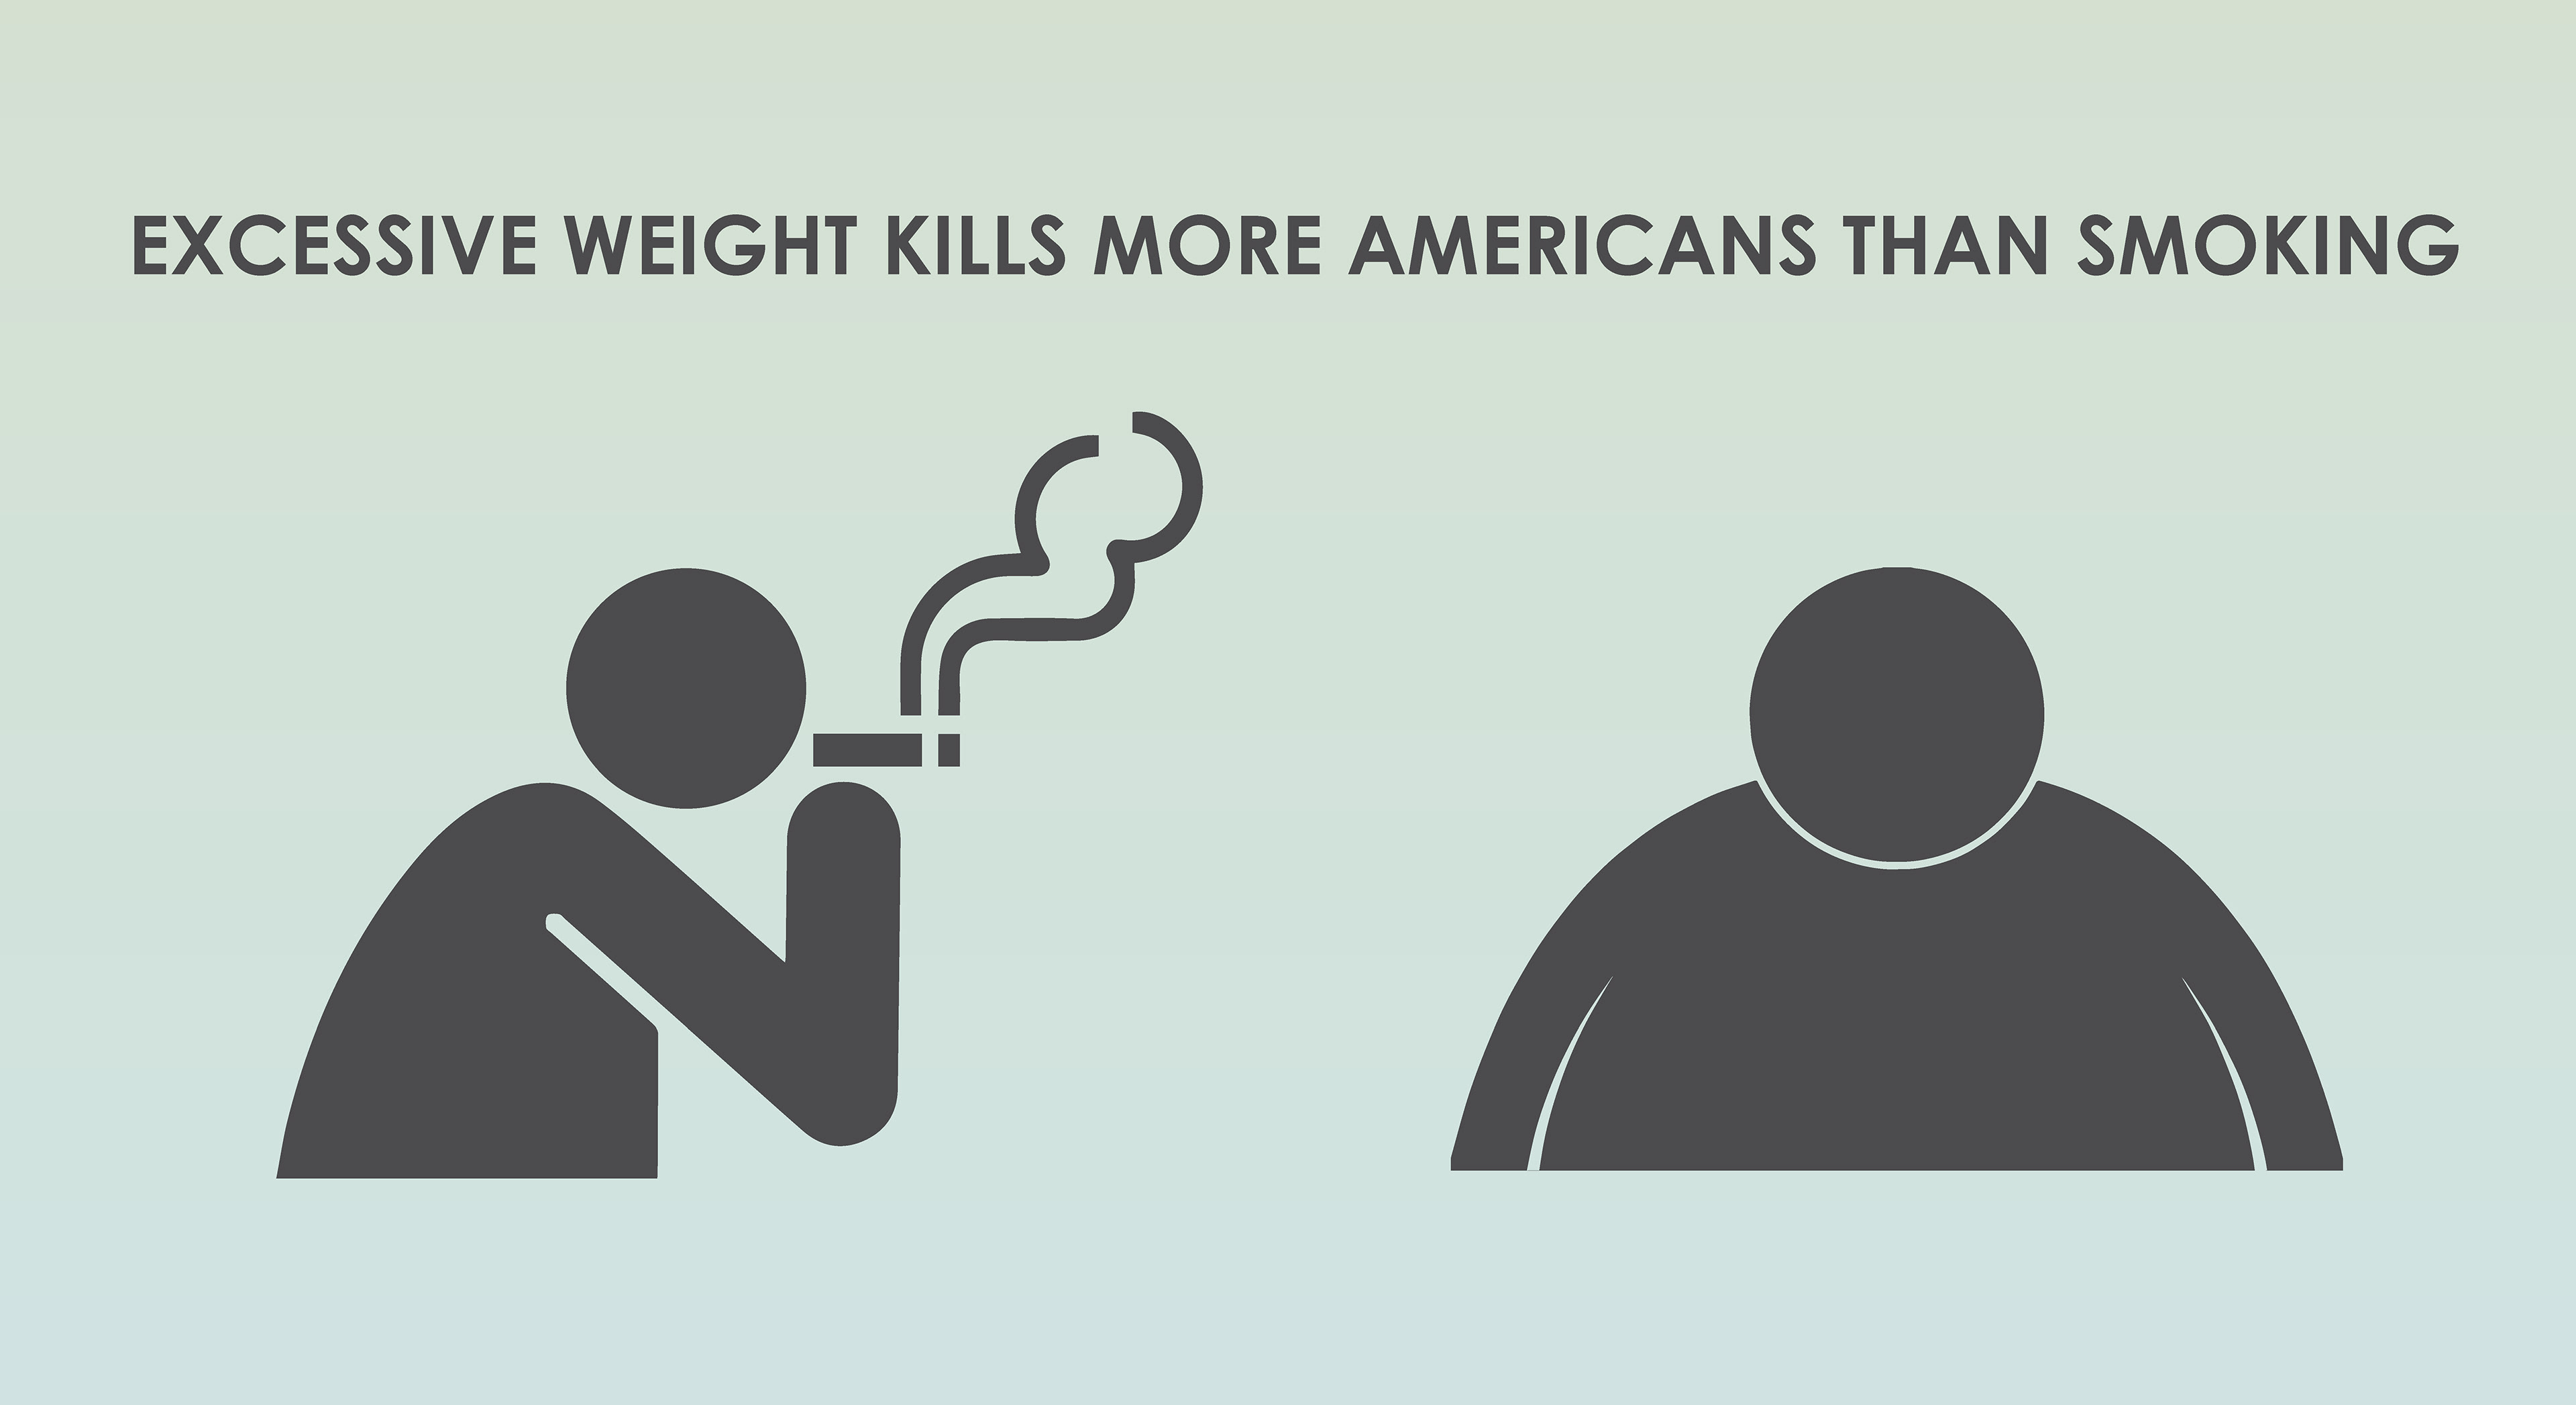
FIGURE 3 - CAUSES OF DEATH IN THE UNITED STATES - Source: (Speck) drawn by author

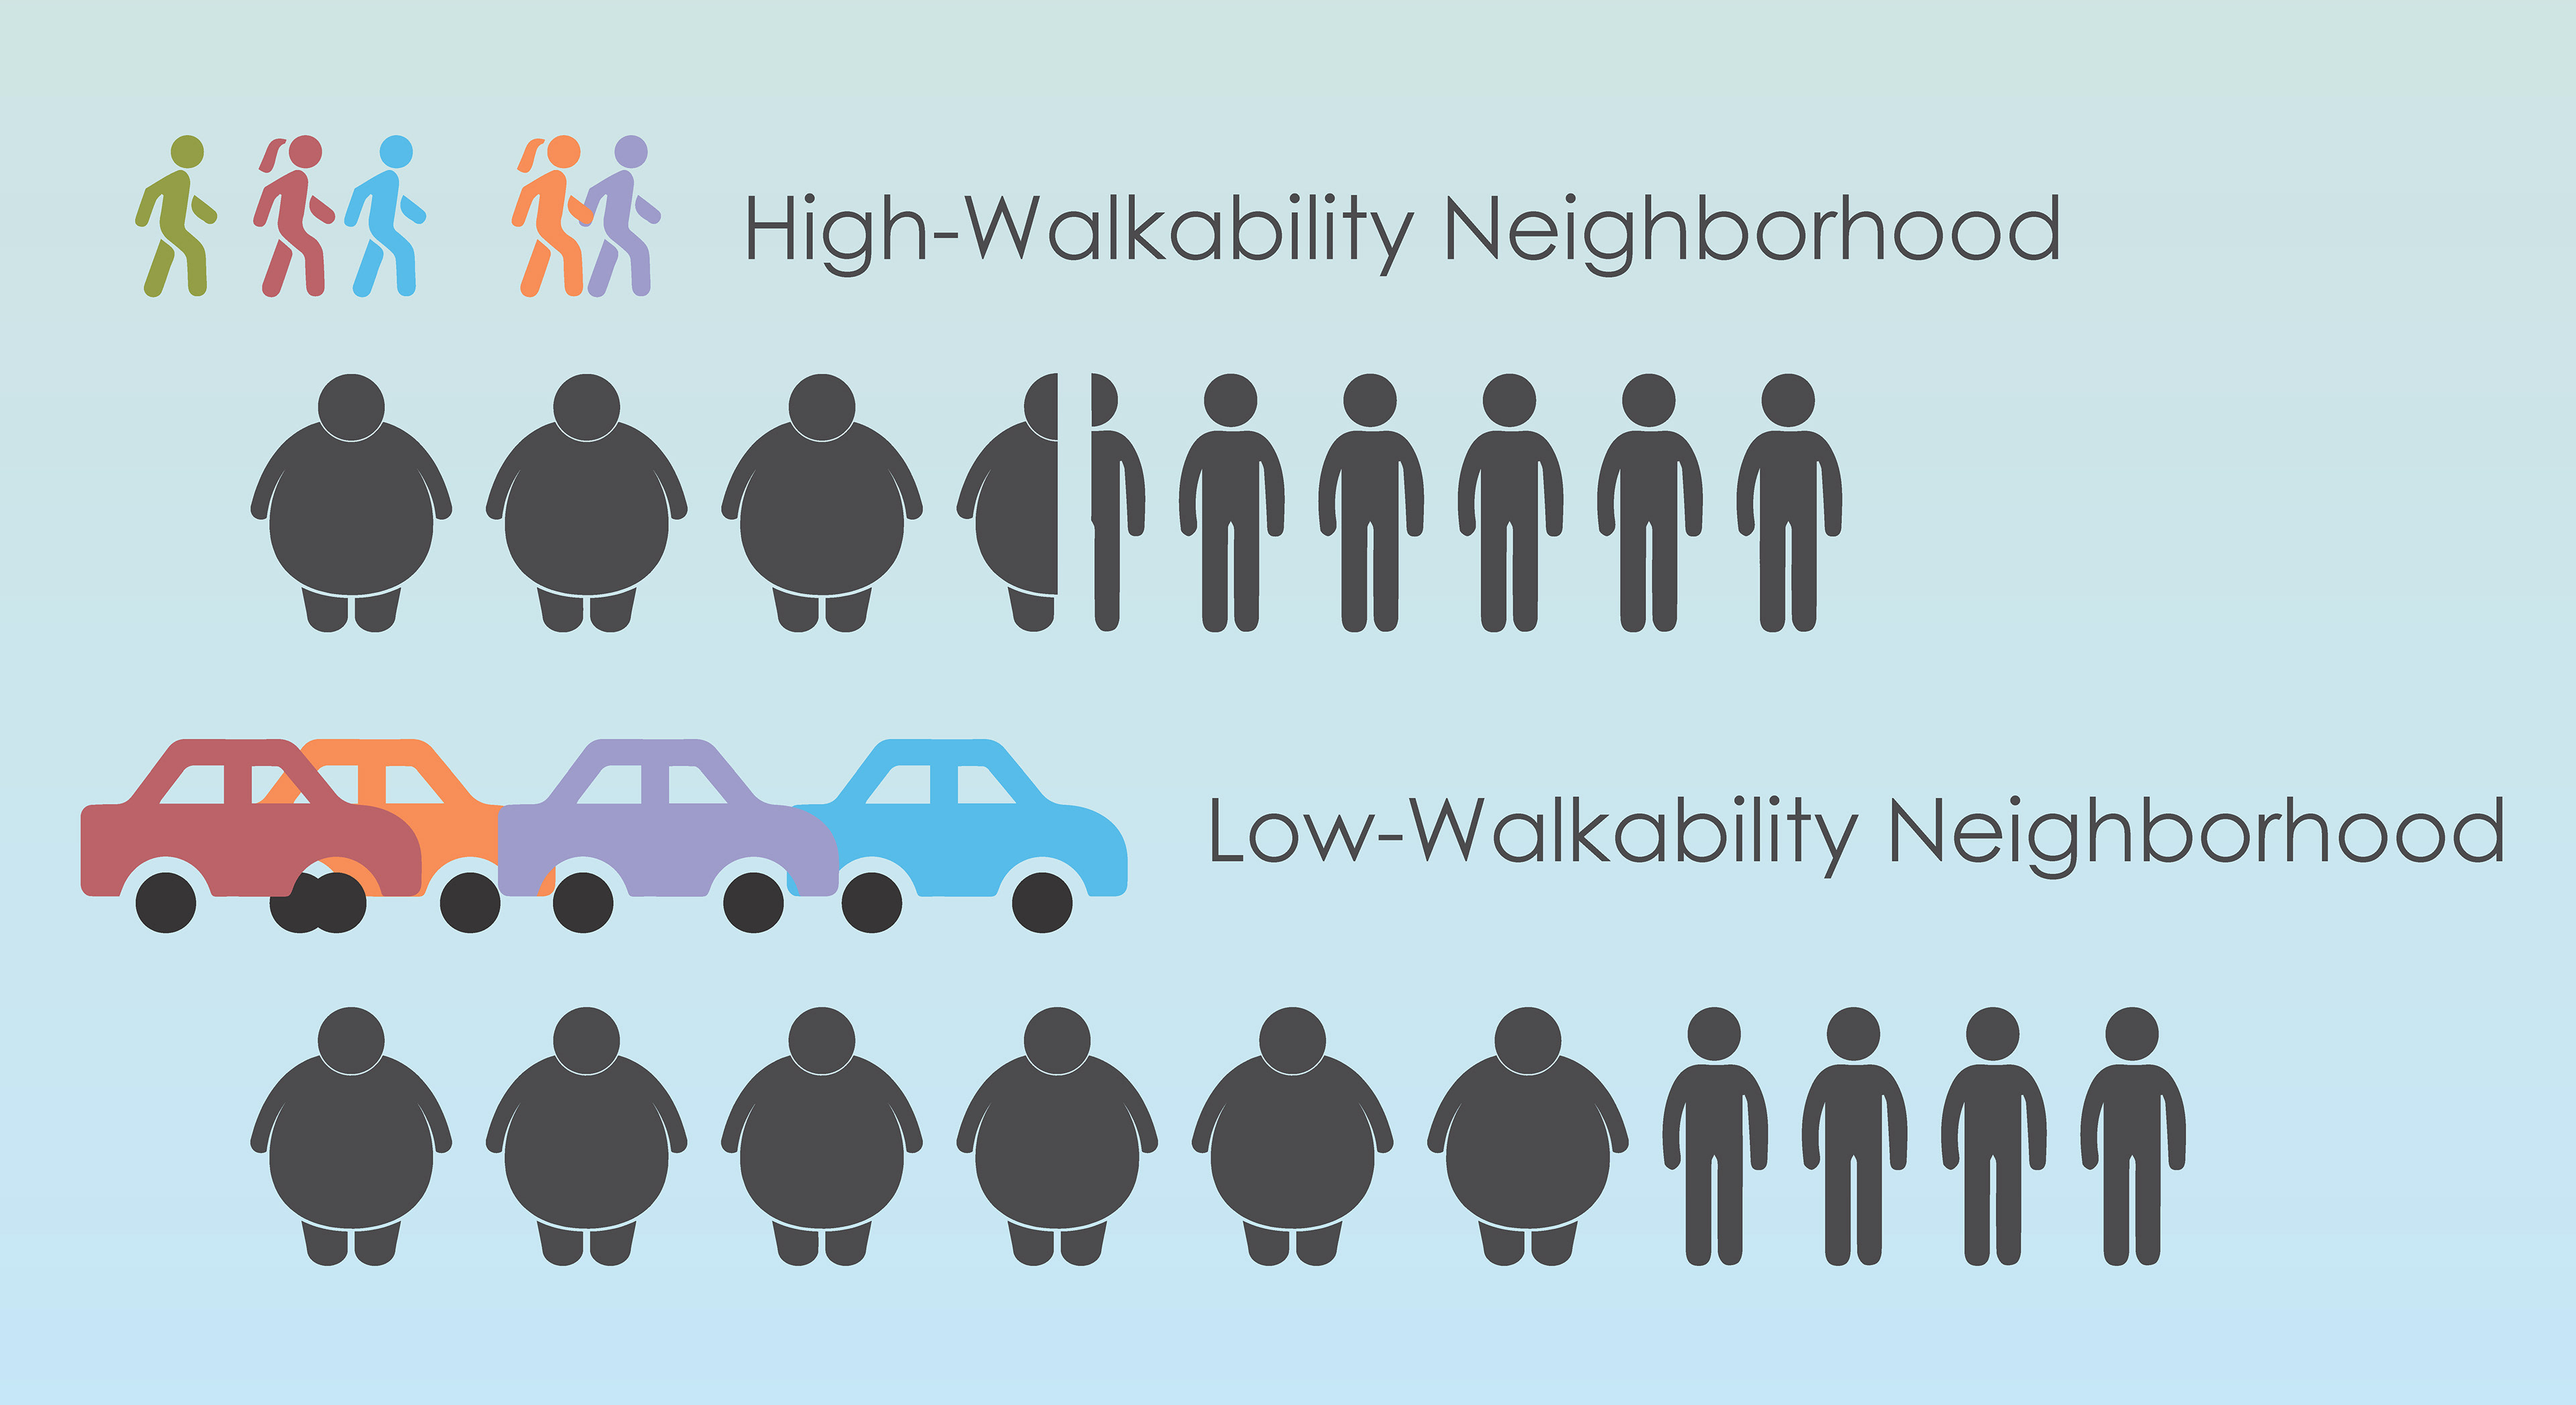
FIGURE 4 - OVERWEIGHT POPULATION IN HIGH WALKABILITY AREAS VERSUS LOW WALKABILITY AREAS IN THE UNITED STATES - Source: (Speck) drawn by author

This series of infographics was developed from statistics presented by Jeff Speck in a Walkable City. In discussing the negative health impacts of the suburban built condition, Speck cites the rise in obesity rates from 1970 to 2007. In 1997, 1 in 10 Americans was obese. By 2007, that had number increased to 3.5 in 10. He also states that excessive weight now kills more Americans than smoking. These statistics are put into the context of walkability in Figure 4, in which the disparity in weight issues in high-walkability neighborhoods and low-walkability neighborhoods in San Diego. 

2.3.    ACTIVITY 
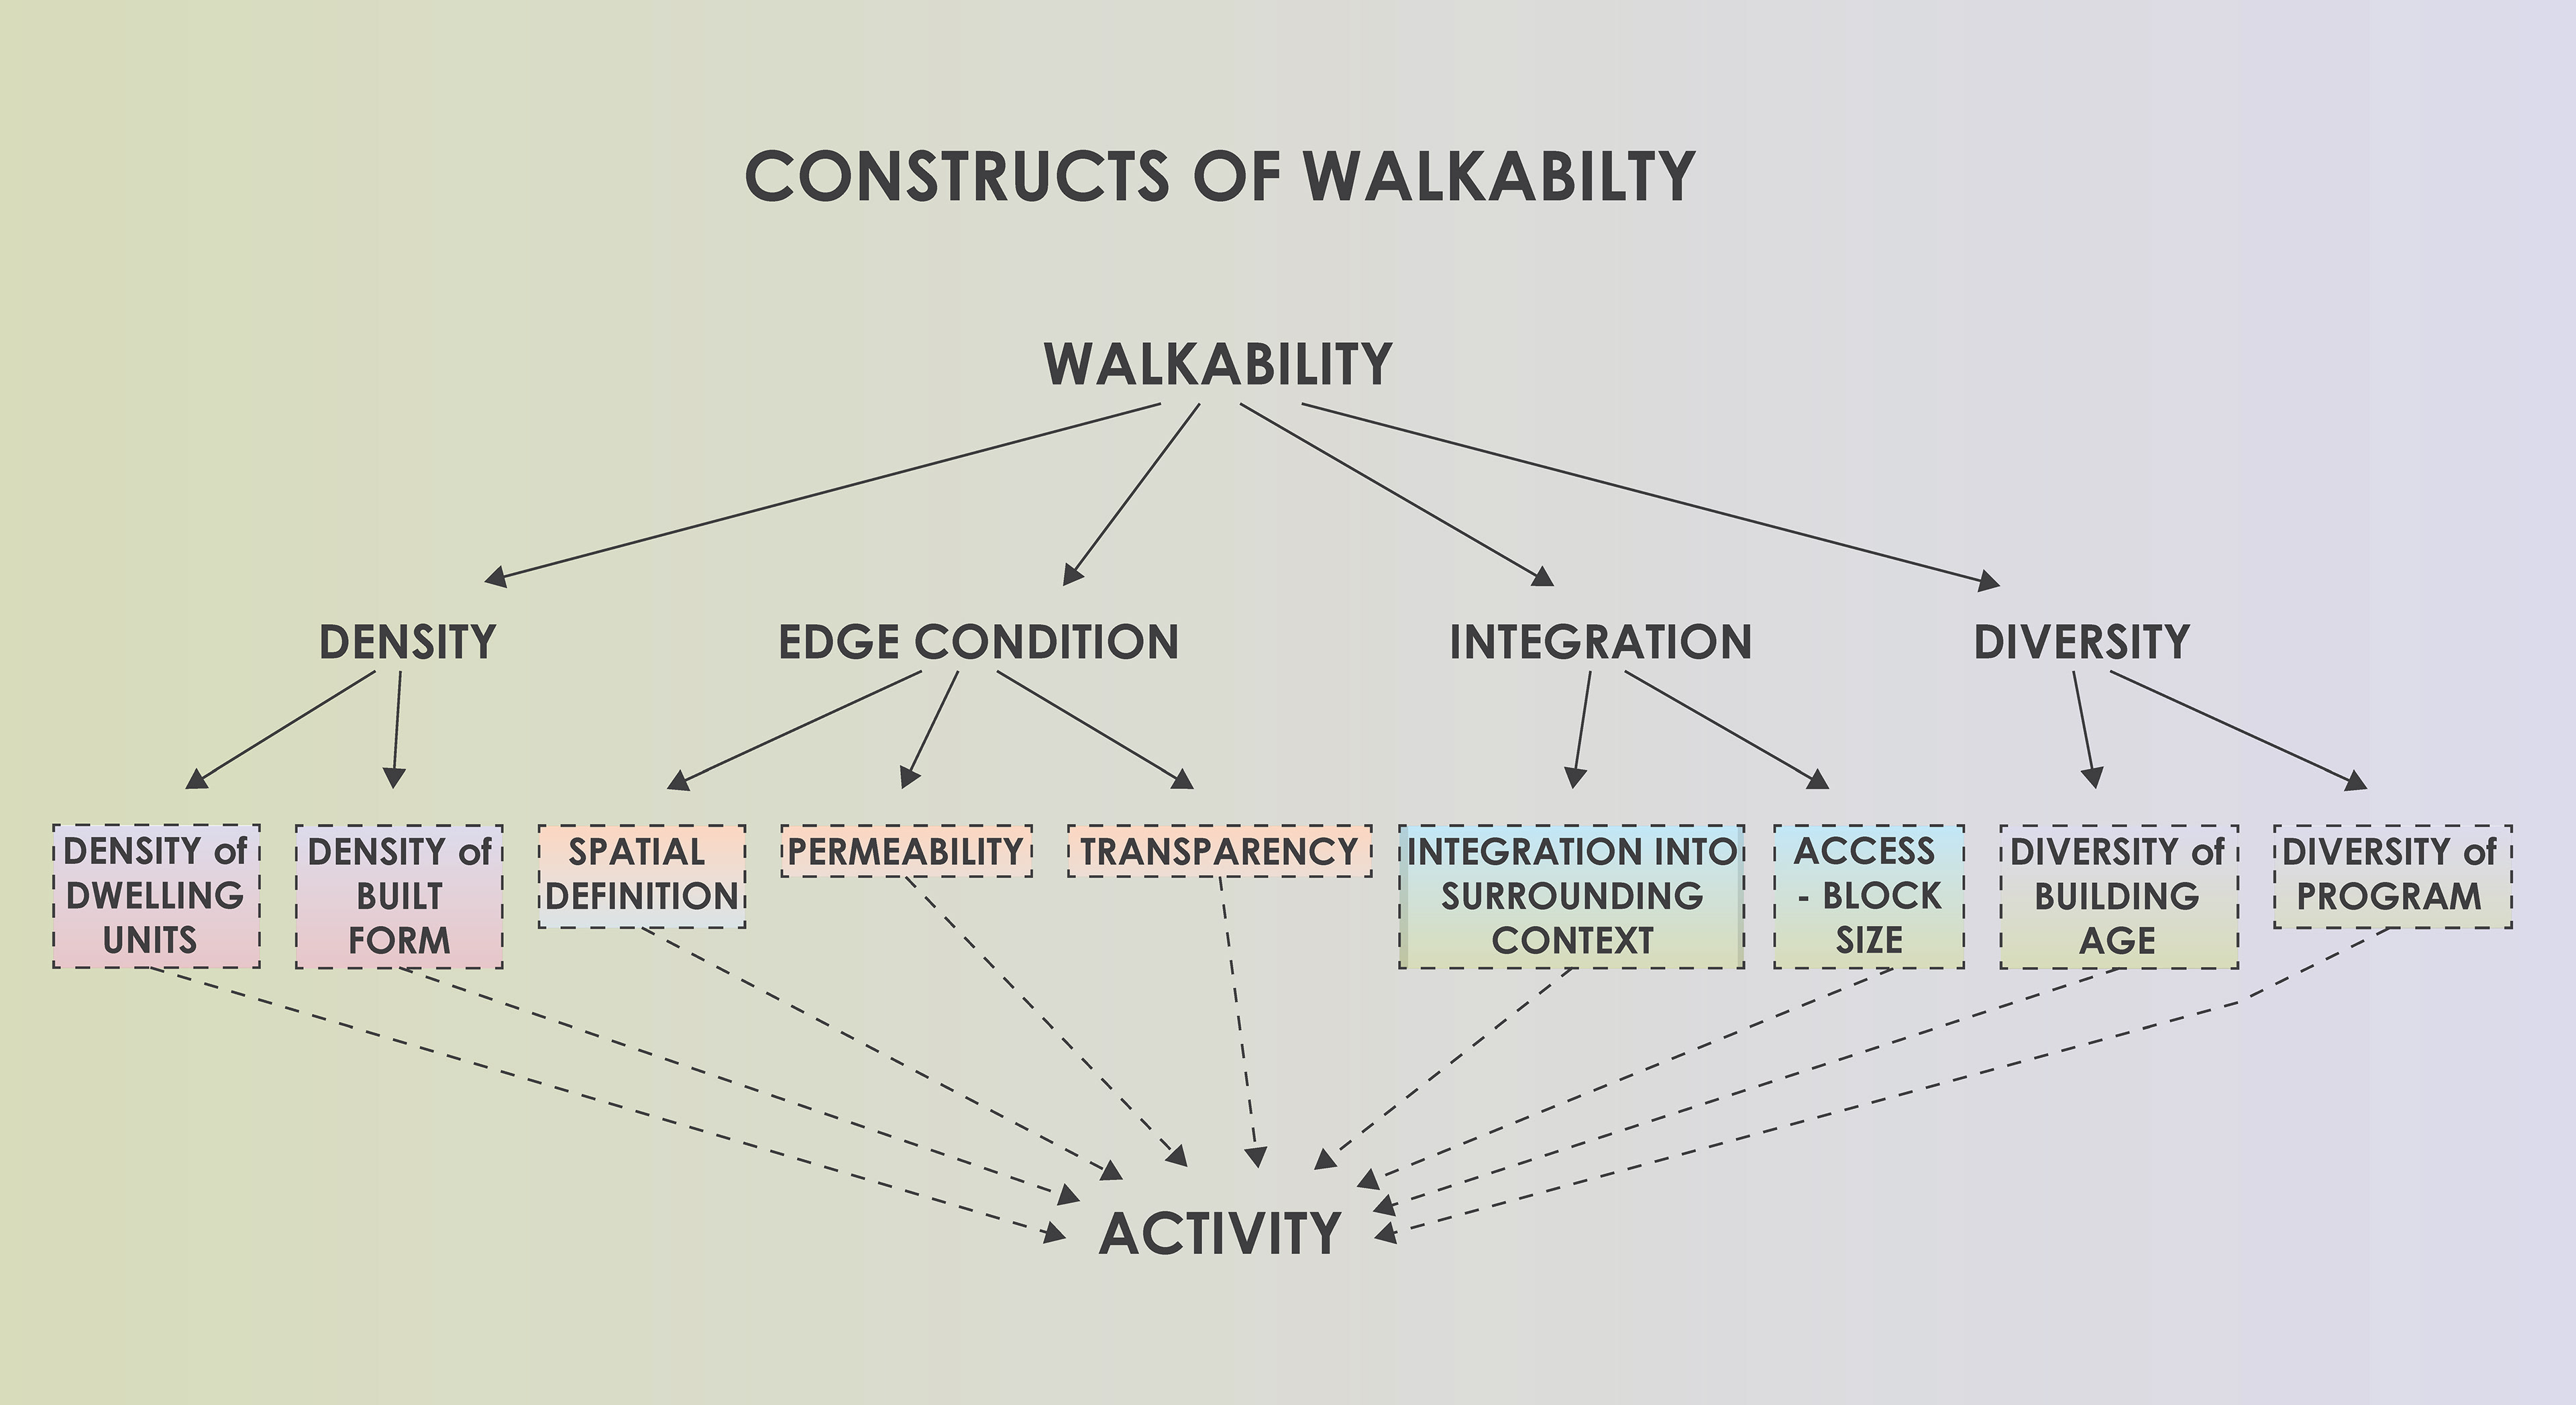
Jane Jacobs describes pedestrian activity as a measurement for performance of the urban street and describes it as vital to the public realm of the city (J. Jacobs 37, 1961). In The Death and Life of Great American Cities, she establishes qualities of built form that attribute to activity and performance of the urban street. This capstone synthesizes constructs that attribute to walkability. These constructs, as seen in Figure 5, are critical aspects of built environments that contribute to activity of public space.
Allan Jacobs describes human activity as key to the making of great public streets. “Void of human activity, streets soon cry out for people, they need people at the same time as they are for them, they are activated by people at the same time as they contribute to making a community for them” (A. Jacobs 303, 1993). Activity acts as a means of safety and creates contact that is essential to the creation of walkable neighborhoods (J. Jacobs 29, 1961). A qualitative sense of habitation is thus created in a walkable neighborhood as these local contacts build relationships and memories that give a site a sense of place (Beauregard 2004).

2.4.    CONSTRUCTS OF WALKABILITY
For pedestrian activity to take place, walkability of our streetscapes is necessary. Walkability involves much more than making it possible to walk from place to place. The standard involves a set of urban concepts which are necessary to generate activity. These urban concepts are described as constructs of walkability in the context of this capstone. As set up in Figure 2, density, edge condition, integration, and diversity are the key principles of walkability. These principles are then broken down into constructs of walkability that can be quantitatively analyzed and/or qualitatively assessed for the purposes of this capstone.
The principle of density involves (A) density of dwelling units and (B) density of built form. The principle edge condition involves the (C) definition of public space, (D) permeability of the built edge, and (E) the transparency of the built edge. The principle of integration involves the (F) integration into surrounding context and (G) access and block size. The principle of diversity involves both the (H) diversity of building age and the (I) diversity of program.

FIGURE 5 - WALKABILITY DIAGRAM - Source: drawn by author

In this section, the constructs of walkability are defined and illustrated. These constructs have been synthesized through writings on urban form as generators of activity. These constructs include the following:
A.    Density of Dwelling Units
B.    Density of Built Form
C.    Built Street Edge – Definition of Public Space
D.    Built Street Edge – Permeability 
E.    Built Street Edge – Transparency 
F.    Integration into Surrounding Context 
G.    Access – Block Size
H.    Diversity of Building Age
I.    Diversity of Program

A.    Density of Dwelling Units
:quantity of dwelling units per unit of land
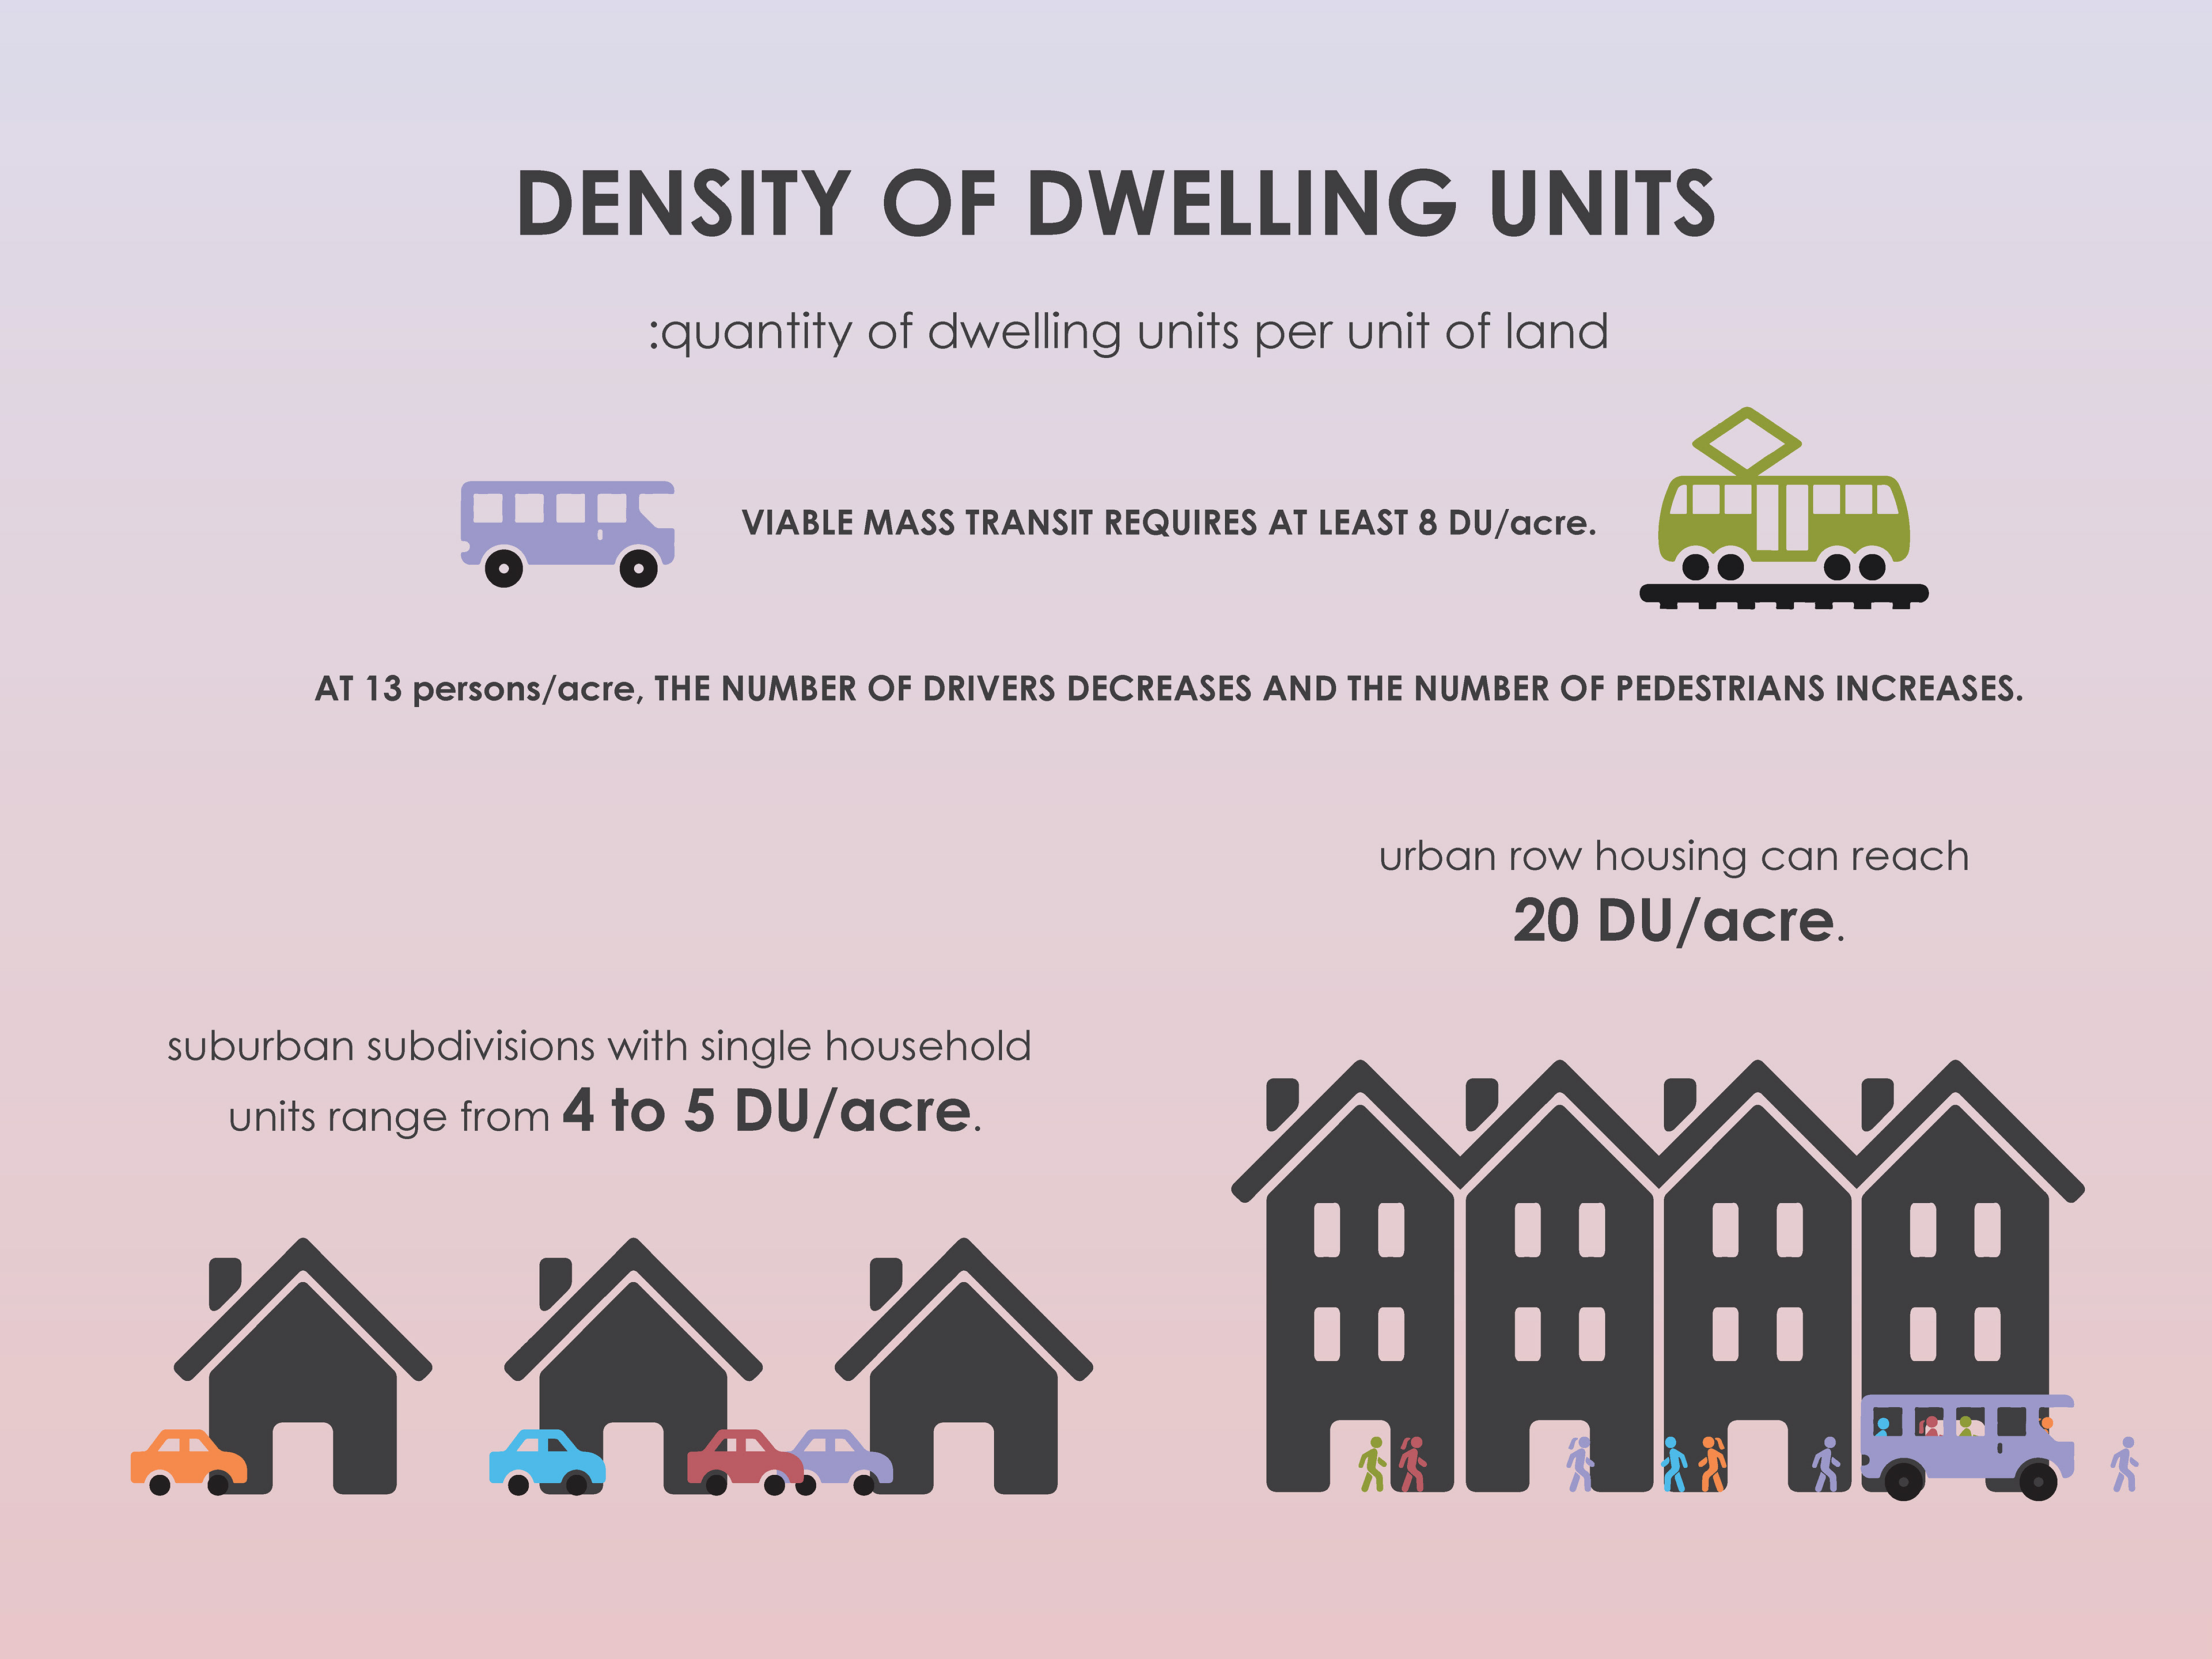
Resident density is critical for viable walkability.  According to Jane Jacobs, there must be enough people regularly residing in an area to support the presence of activity-driving entities such as standard small shops and restaurants (J. Jacobs 1961). She describes population density as key to the economic viability and security of city streets. Jacobs is certainly not alone in recognizing the necessity of population density for walkable cities. According to Dunham-Jones, when population density reaches 13 people per acre, the number of people who will walk increases and the number of those who will drive decreases. At 8 dwelling units per acre, mass transit becomes viable. Mass transit is an infrastructural element that allows for a greater integration of pocket walkability into the surrounding communities, attracting more activity and habitation (Dunham-Jones 175, 2009). Density of Dwelling Units is illustrated in Figure 6.

FIGURE 6 - DENSITY OF DWELLING UNITS - Source: drawn by author

B.    Density of Built Form
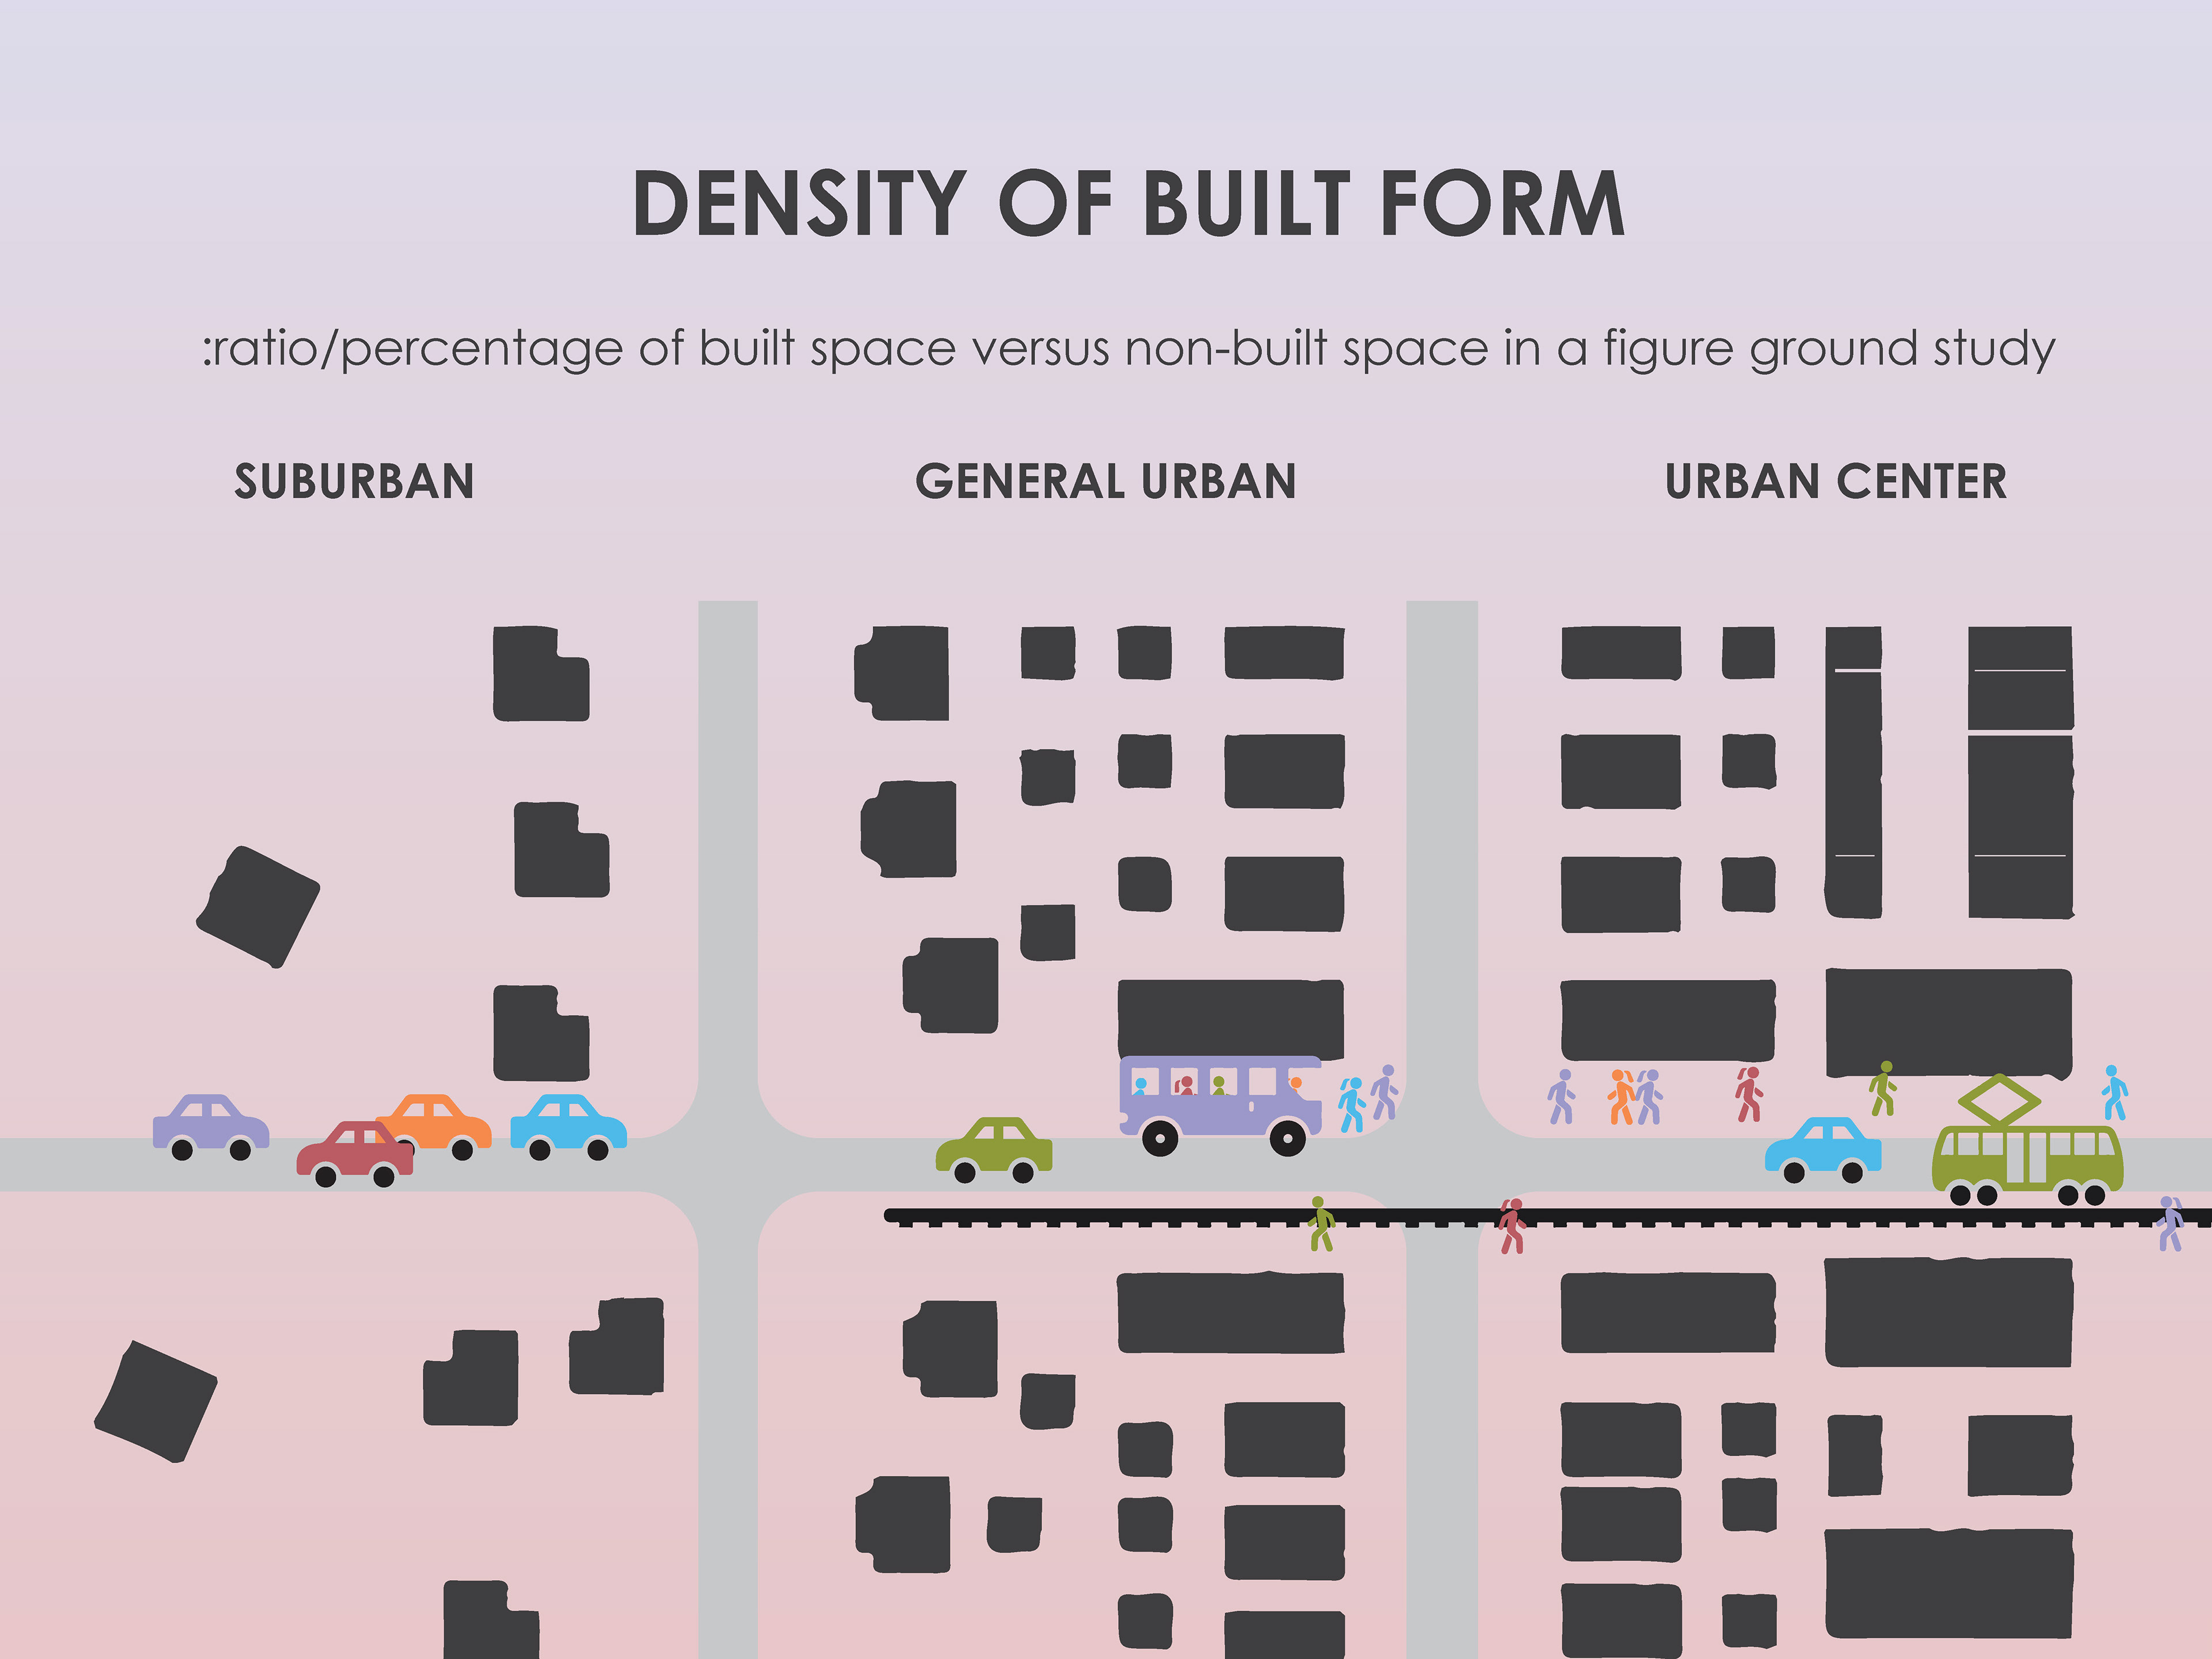
:ratio/percentage of built space versus non-built space in a figure-ground study
In the context of this capstone, density of built form refers to the ratio of built form to non-built space that can be analyzed though figure-ground study. Height of buildings is considered in another construct. Density of built form can be further described as the ratio of building versus the amount of open space left to the public. In Collage City, Colin Rowe explores this ratio in the traditional city and the modern city through figure-ground studies. He explains that the modern city creates public spaces that are spatially residual and ill-defined. The building becomes figural rather than the public space. This has created major problems when used in its cheapest form in the American suburb. “The city in the park becomes the city in the parking lot (Rowe 65, 1984).” Built density is vital for other critical constructs of walkability, specifically density of dwelling units and spatial definition of public space.  
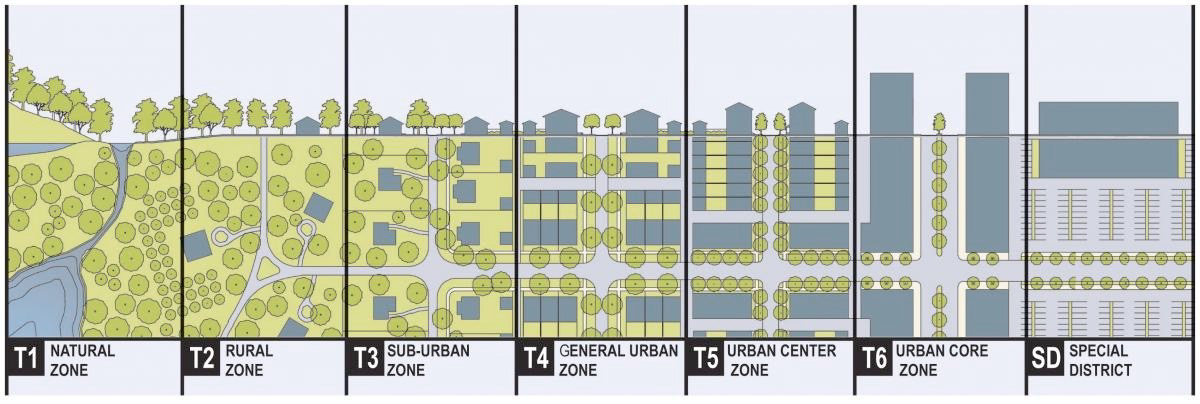
Transect zones as described by the Congress for the New Urbanism are set up according to density of built form, among other aspect. The CNU has diagrammed these transect zones as seen in Figure 7. Often in the development of a suburban retrofit, the area densifies and often begins to resemble a higher transect zone within this framework. Density of Built Form is illustrated in Figure 8.

FIGURE 7 - CONGRESS for the NEW URBANISM TRANSECT DIAGRAM - Source: (CNU 2017)

FIGURE 8 - DENSITY OF BUILT FORM - Source: drawn by author

C.    Built Street Edge - Definition of Public Space
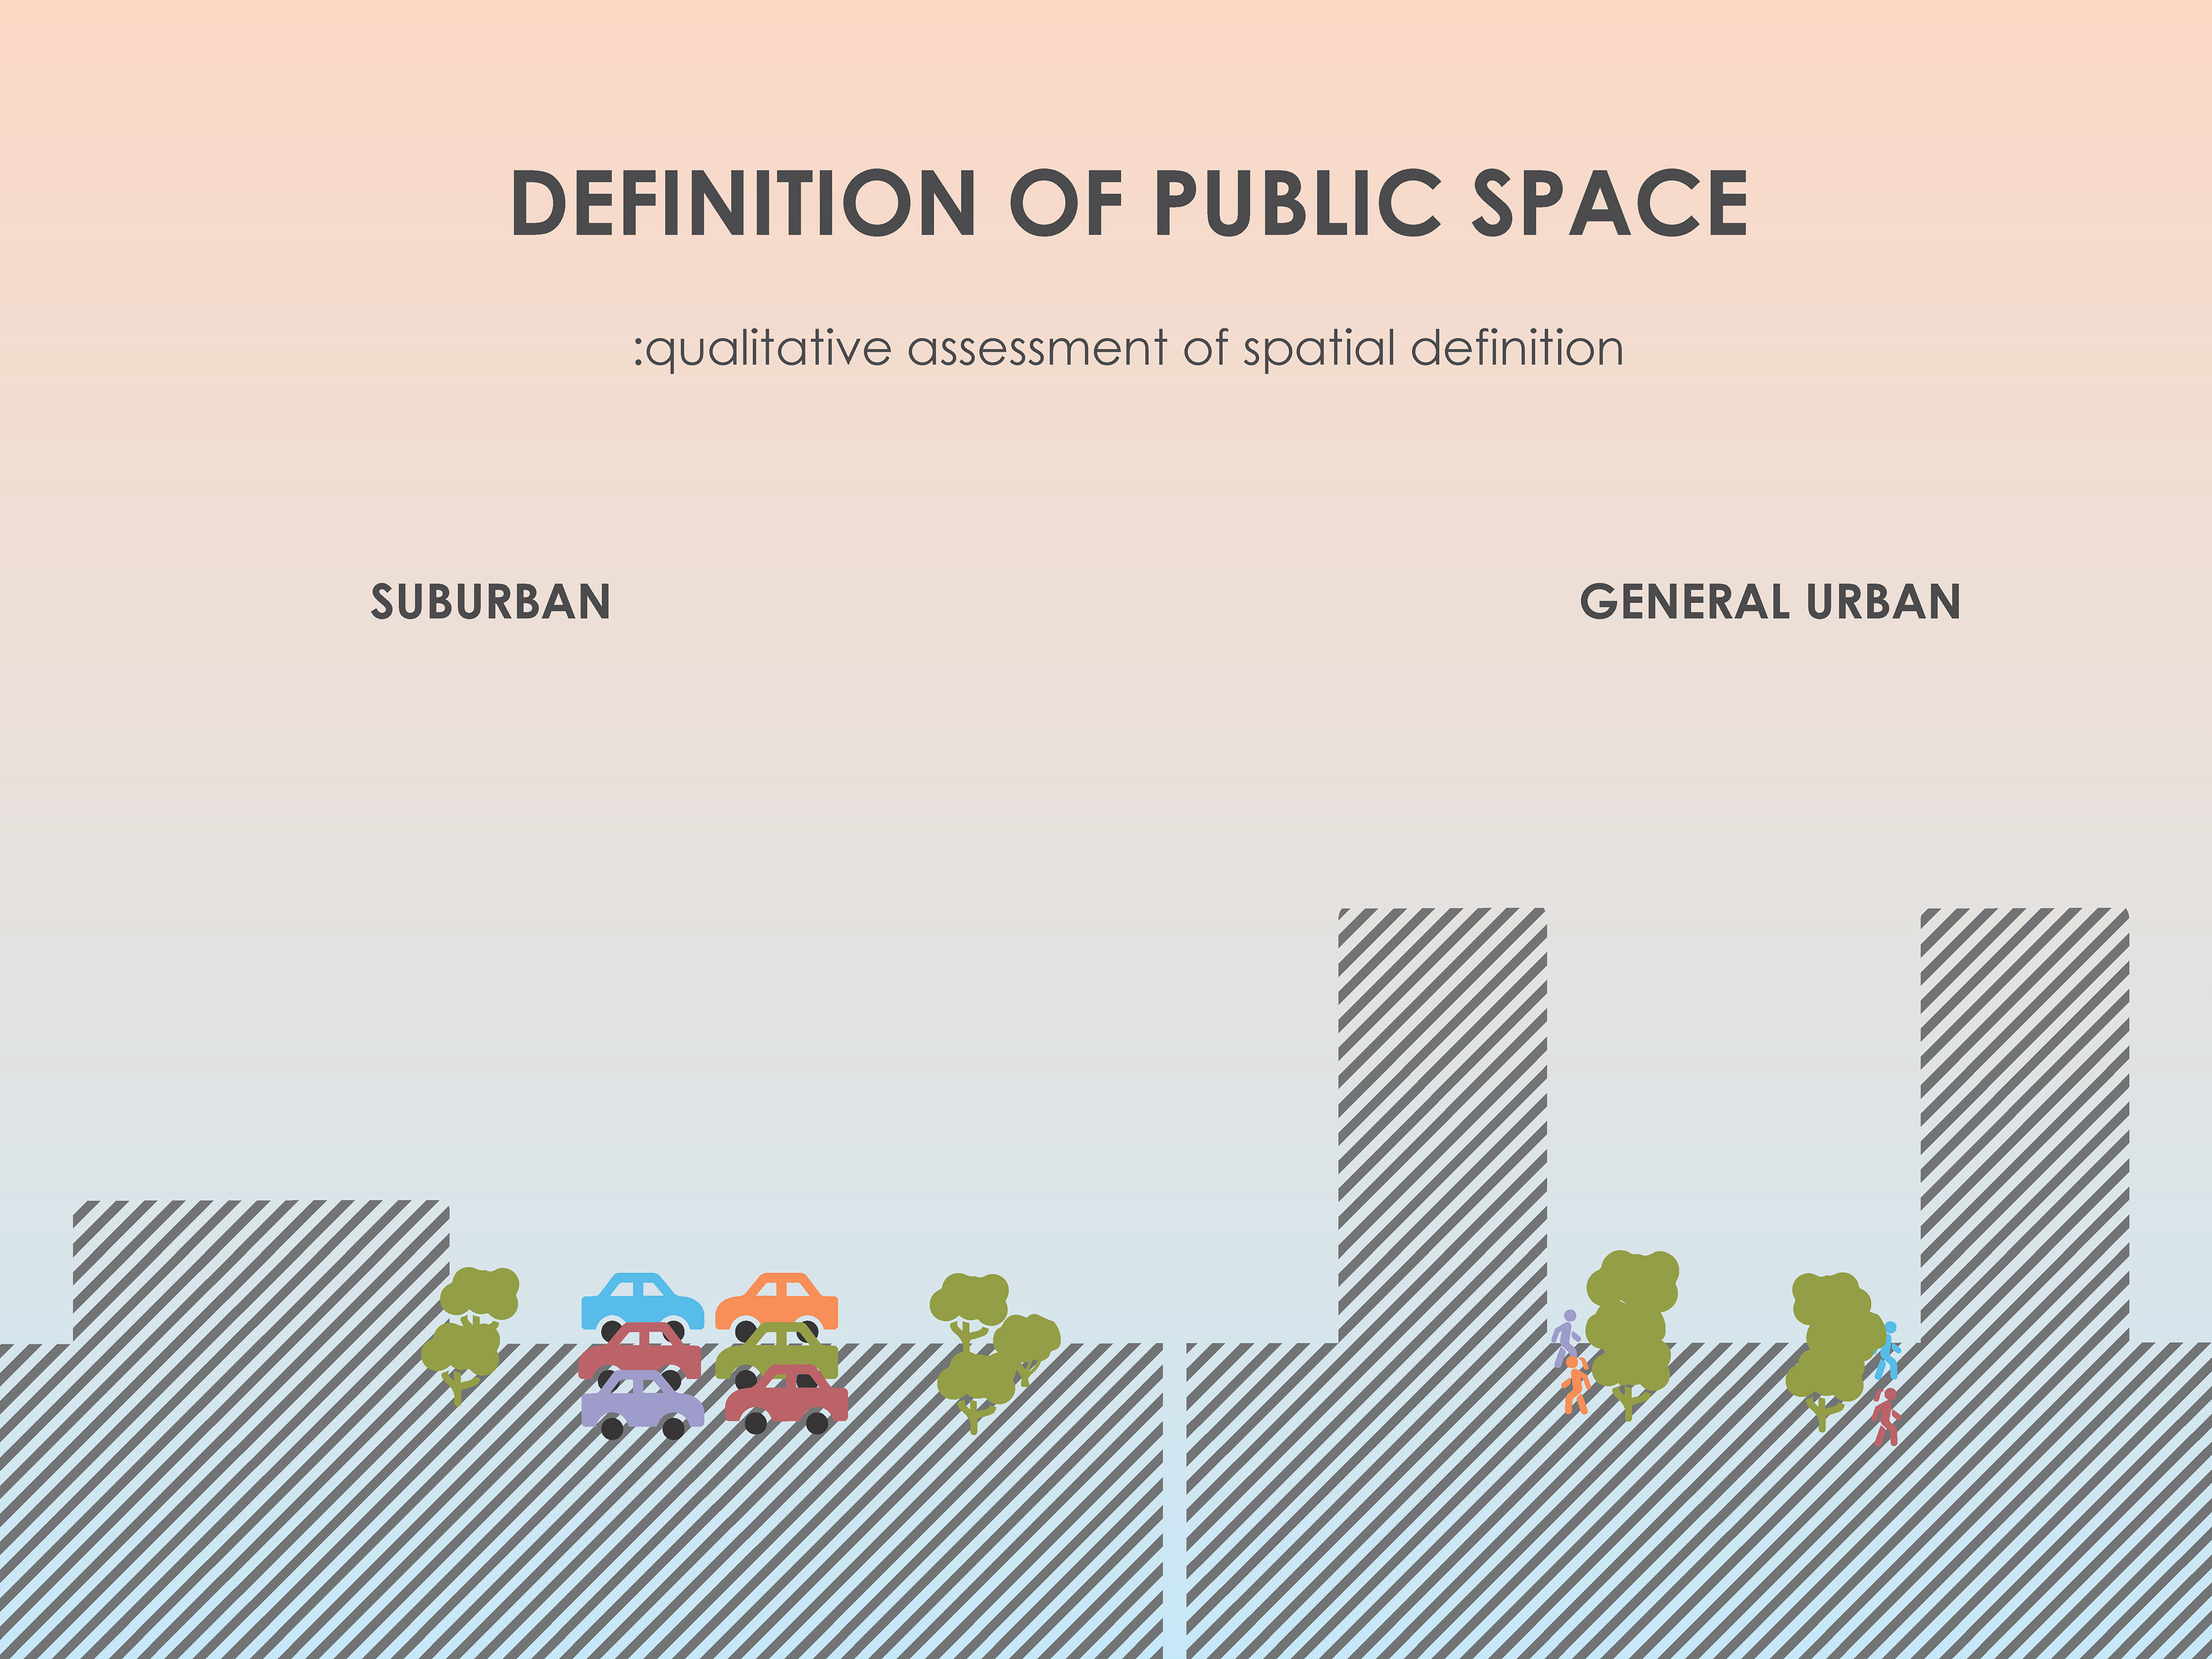
:qualitative assessment of spatial definition
“A sense of place: your ability to create places that are meaningful and places of quality and character depends entirely on your ability to define space with buildings” (Kunstler 2004). A lack of spatial definition in public realm that has failed to provide an adequate backing to support active public life in the American suburb. 
According to Allan Jacobs, great streets are well-defined and have clear boundaries (A. Jacobs 277, 1993). He describes spatial definition of the public realm as a ratio of vertical height of the edges to the width of the space in between. Spatial definition is cognitive and perceptual and deals with the relationship to a recognizable human scale, making this a qualitative construct of walkability. Buildings, street trees, parked vehicles, and street furniture are the defining elements of public space. These elements can be documented in street sections and supported with experiential photography and sketching. The heights of buildings and trees are important aspects of spatial definition and adequate built form density is required to provide for these defining elements. Definition of Public Space is illustrated in Figure 9.

FIGURE 9 - DEFINITION OF PUBLIC SPACE - Source: drawn by author

D.    Built Street Edge - Permeability
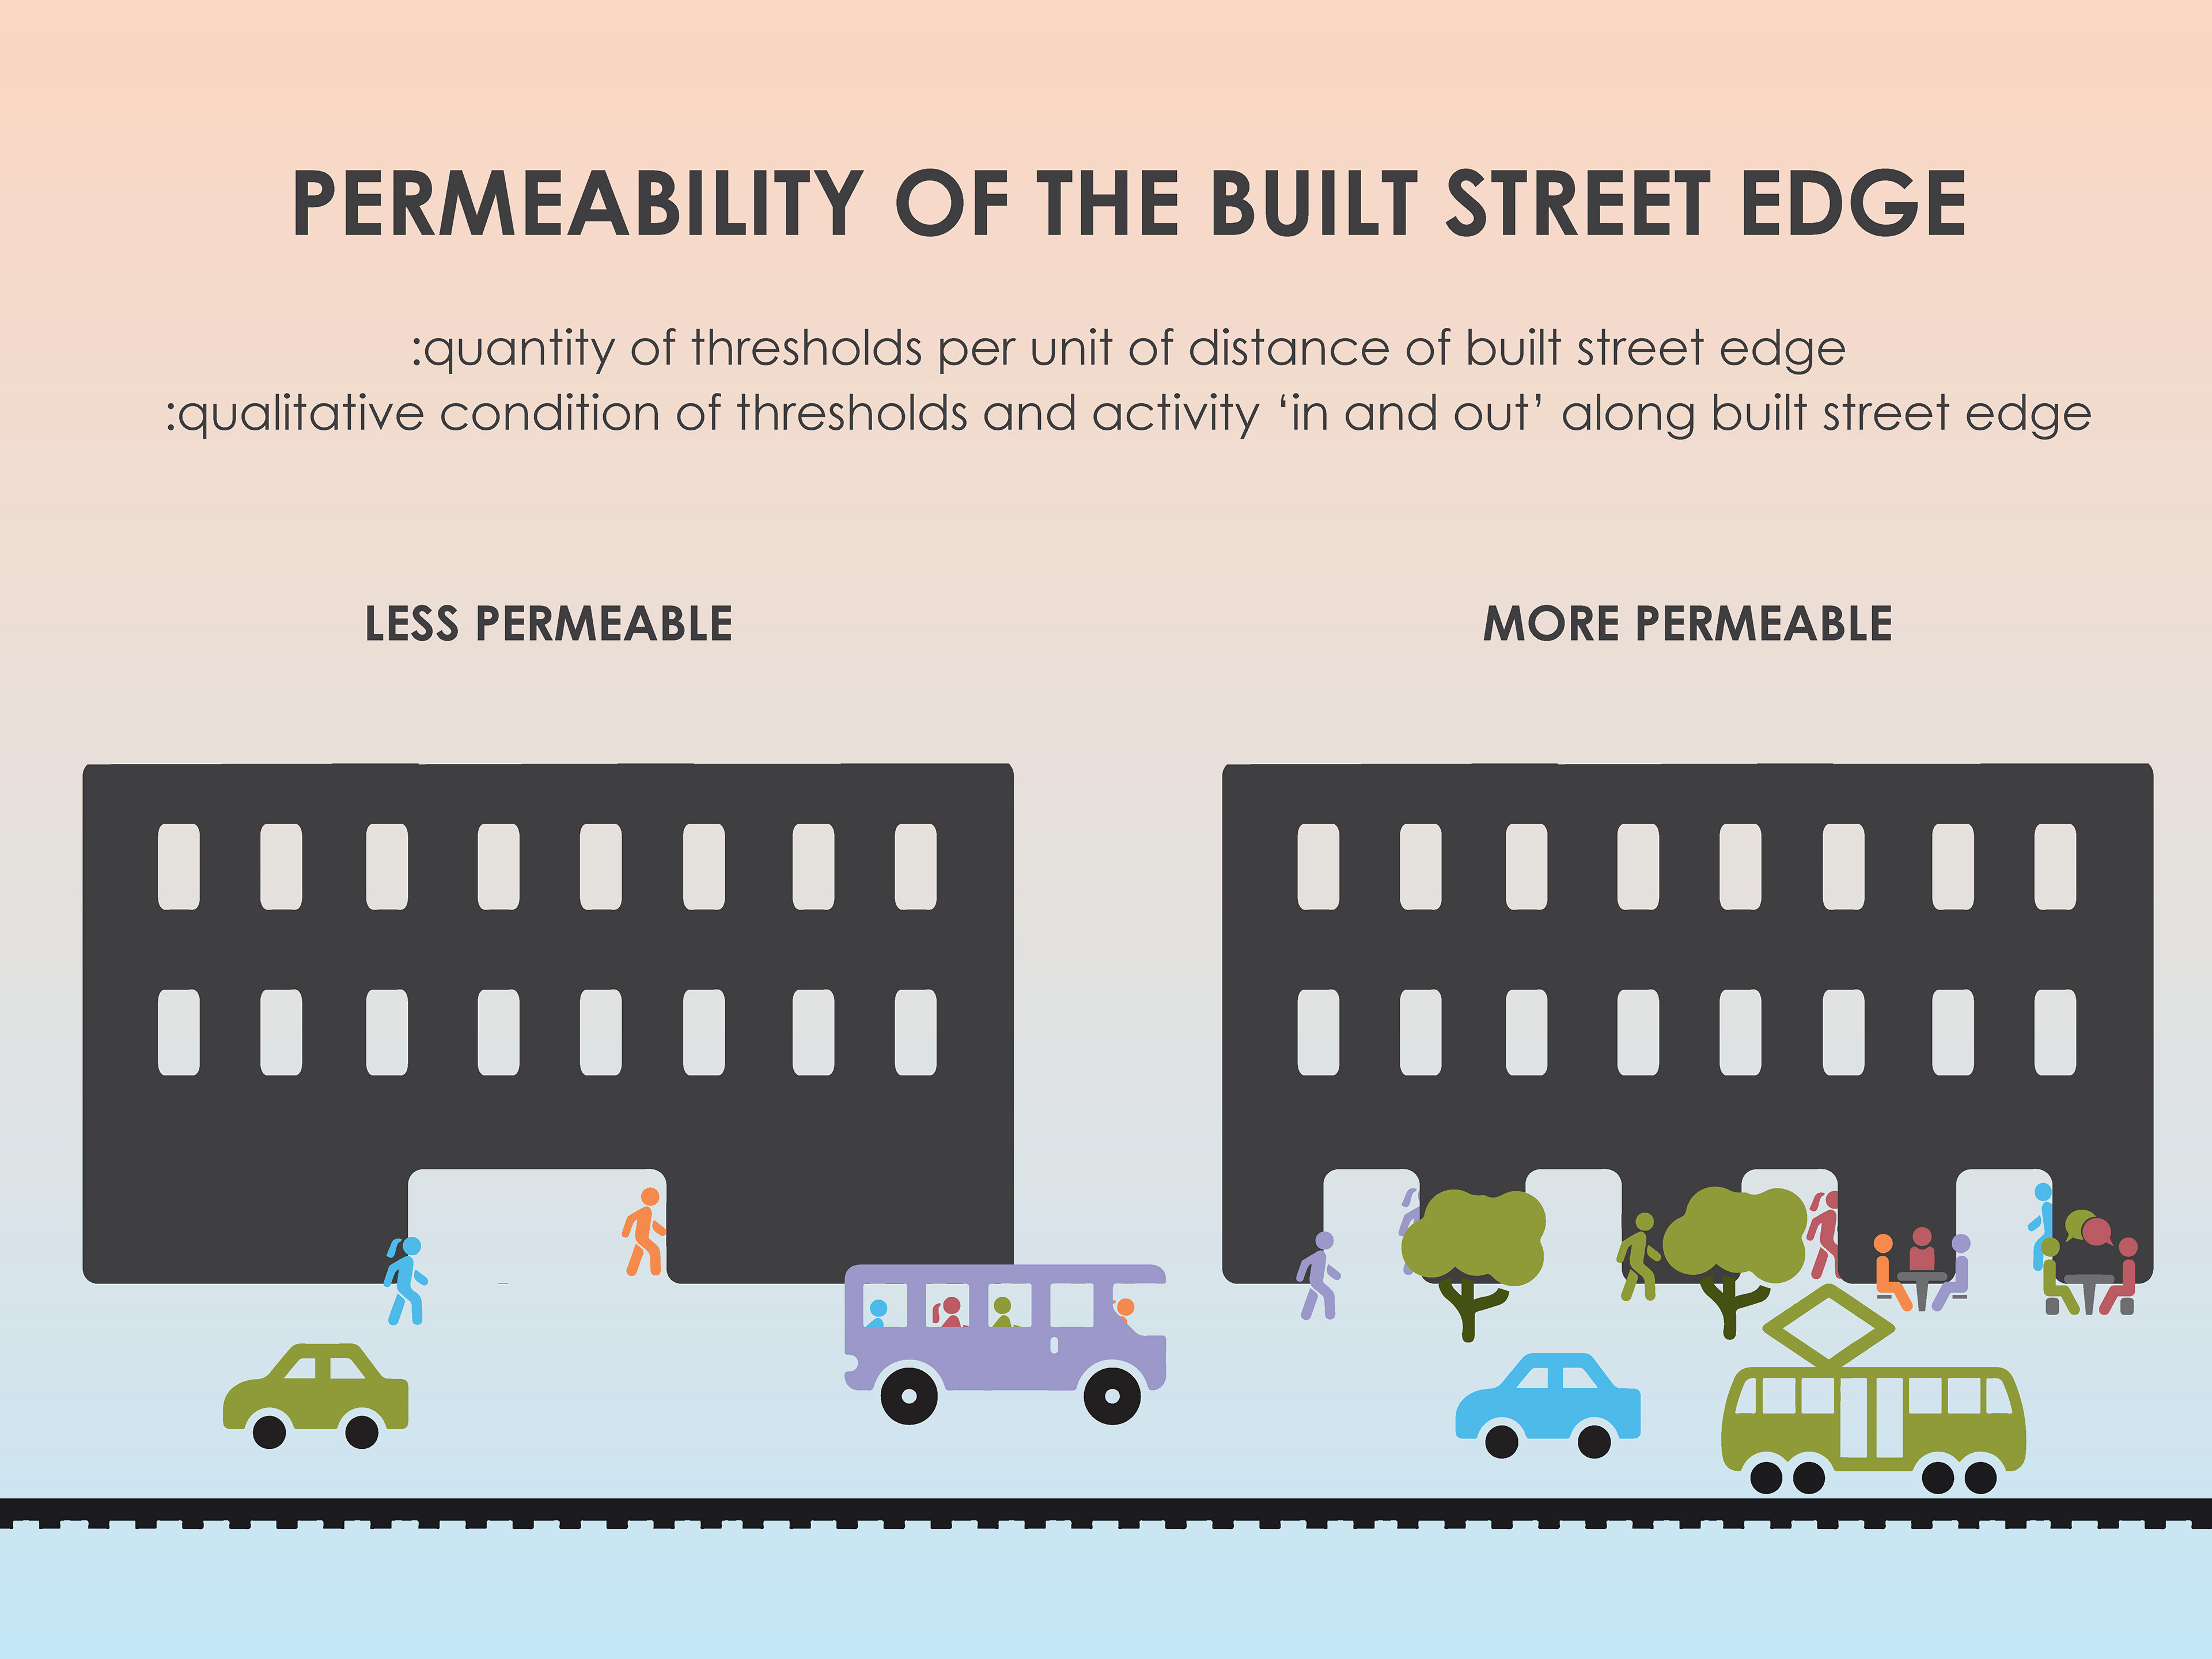
:quantity of thresholds per units of distance of built street edge
:qualitative condition of thresholds and activity ‘in and out’ along built street edge
Permeability of the built street edge deals with the quality, character, and frequency of thresholds along a street edge and is a critical aspect of walkability. This construct can be analyzed both quantitatively and qualitatively.
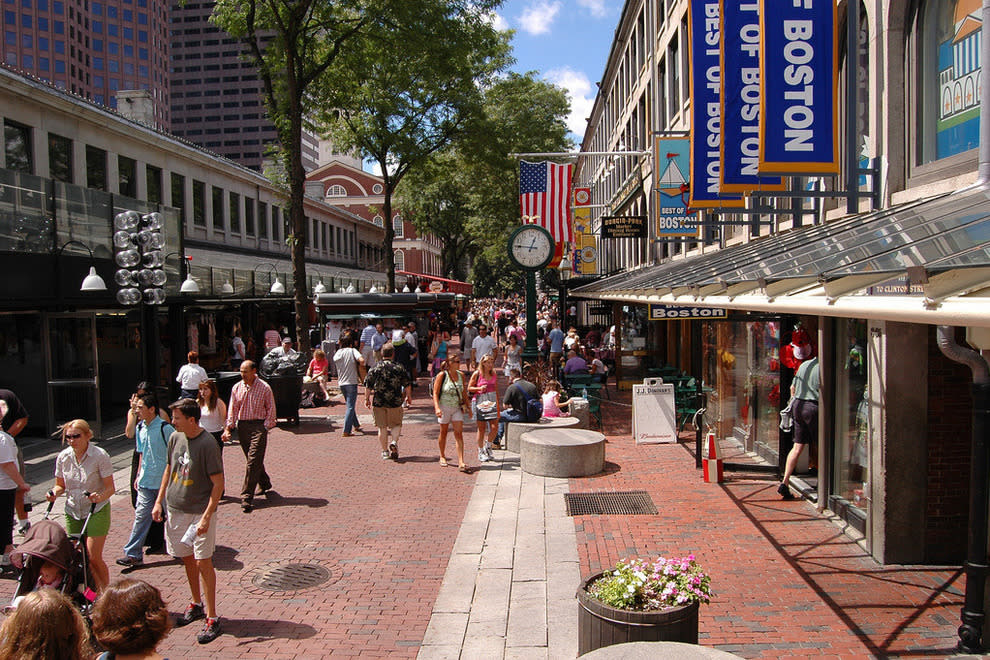
Quantitatively, thresholds can be counted along the distance of a built street edge. Jane Jacobs links frequency of threshold to the diversity of program construct as defined within this capstone, stating that thresholds along the street edge must be frequent enough to actively engage the pedestrian with a variety of program (J. Jacobs 152, 1961). In a 2004 Ted Talk, James Howard Kunstler reinforces this concept, explaining the necessity of a permeable street edge in activating public space. Referring to an image similar to Figure 4, he states, “This is a good public space. It’s well defined. It is emphatically an outdoor public room. It has something that is terribly important -- it has what’s called an active and permeable membrane around the edge. That’s a fancy way of saying it’s got shops, bars, bistros, destinations -- things go in and out of it. It’s permeable” (Kunstler 2004). Frequency and quality of threshold can be used to measure this construct of walkability. Permeability of the Built Street Edge is illustrated in Figure 11.

FIGURE 10 - PERMEABLE AND TRANSPARENT BUILT EDGE - Source: (Greater Boston Convention and Visitors Bureau 2018)

FIGURE 11 - PERMEABILITY OF THE BUILT STREET EDGE - Source: drawn by author

E.    Built Street Edge - Transparency
:visual connection between interior activity and exterior activity
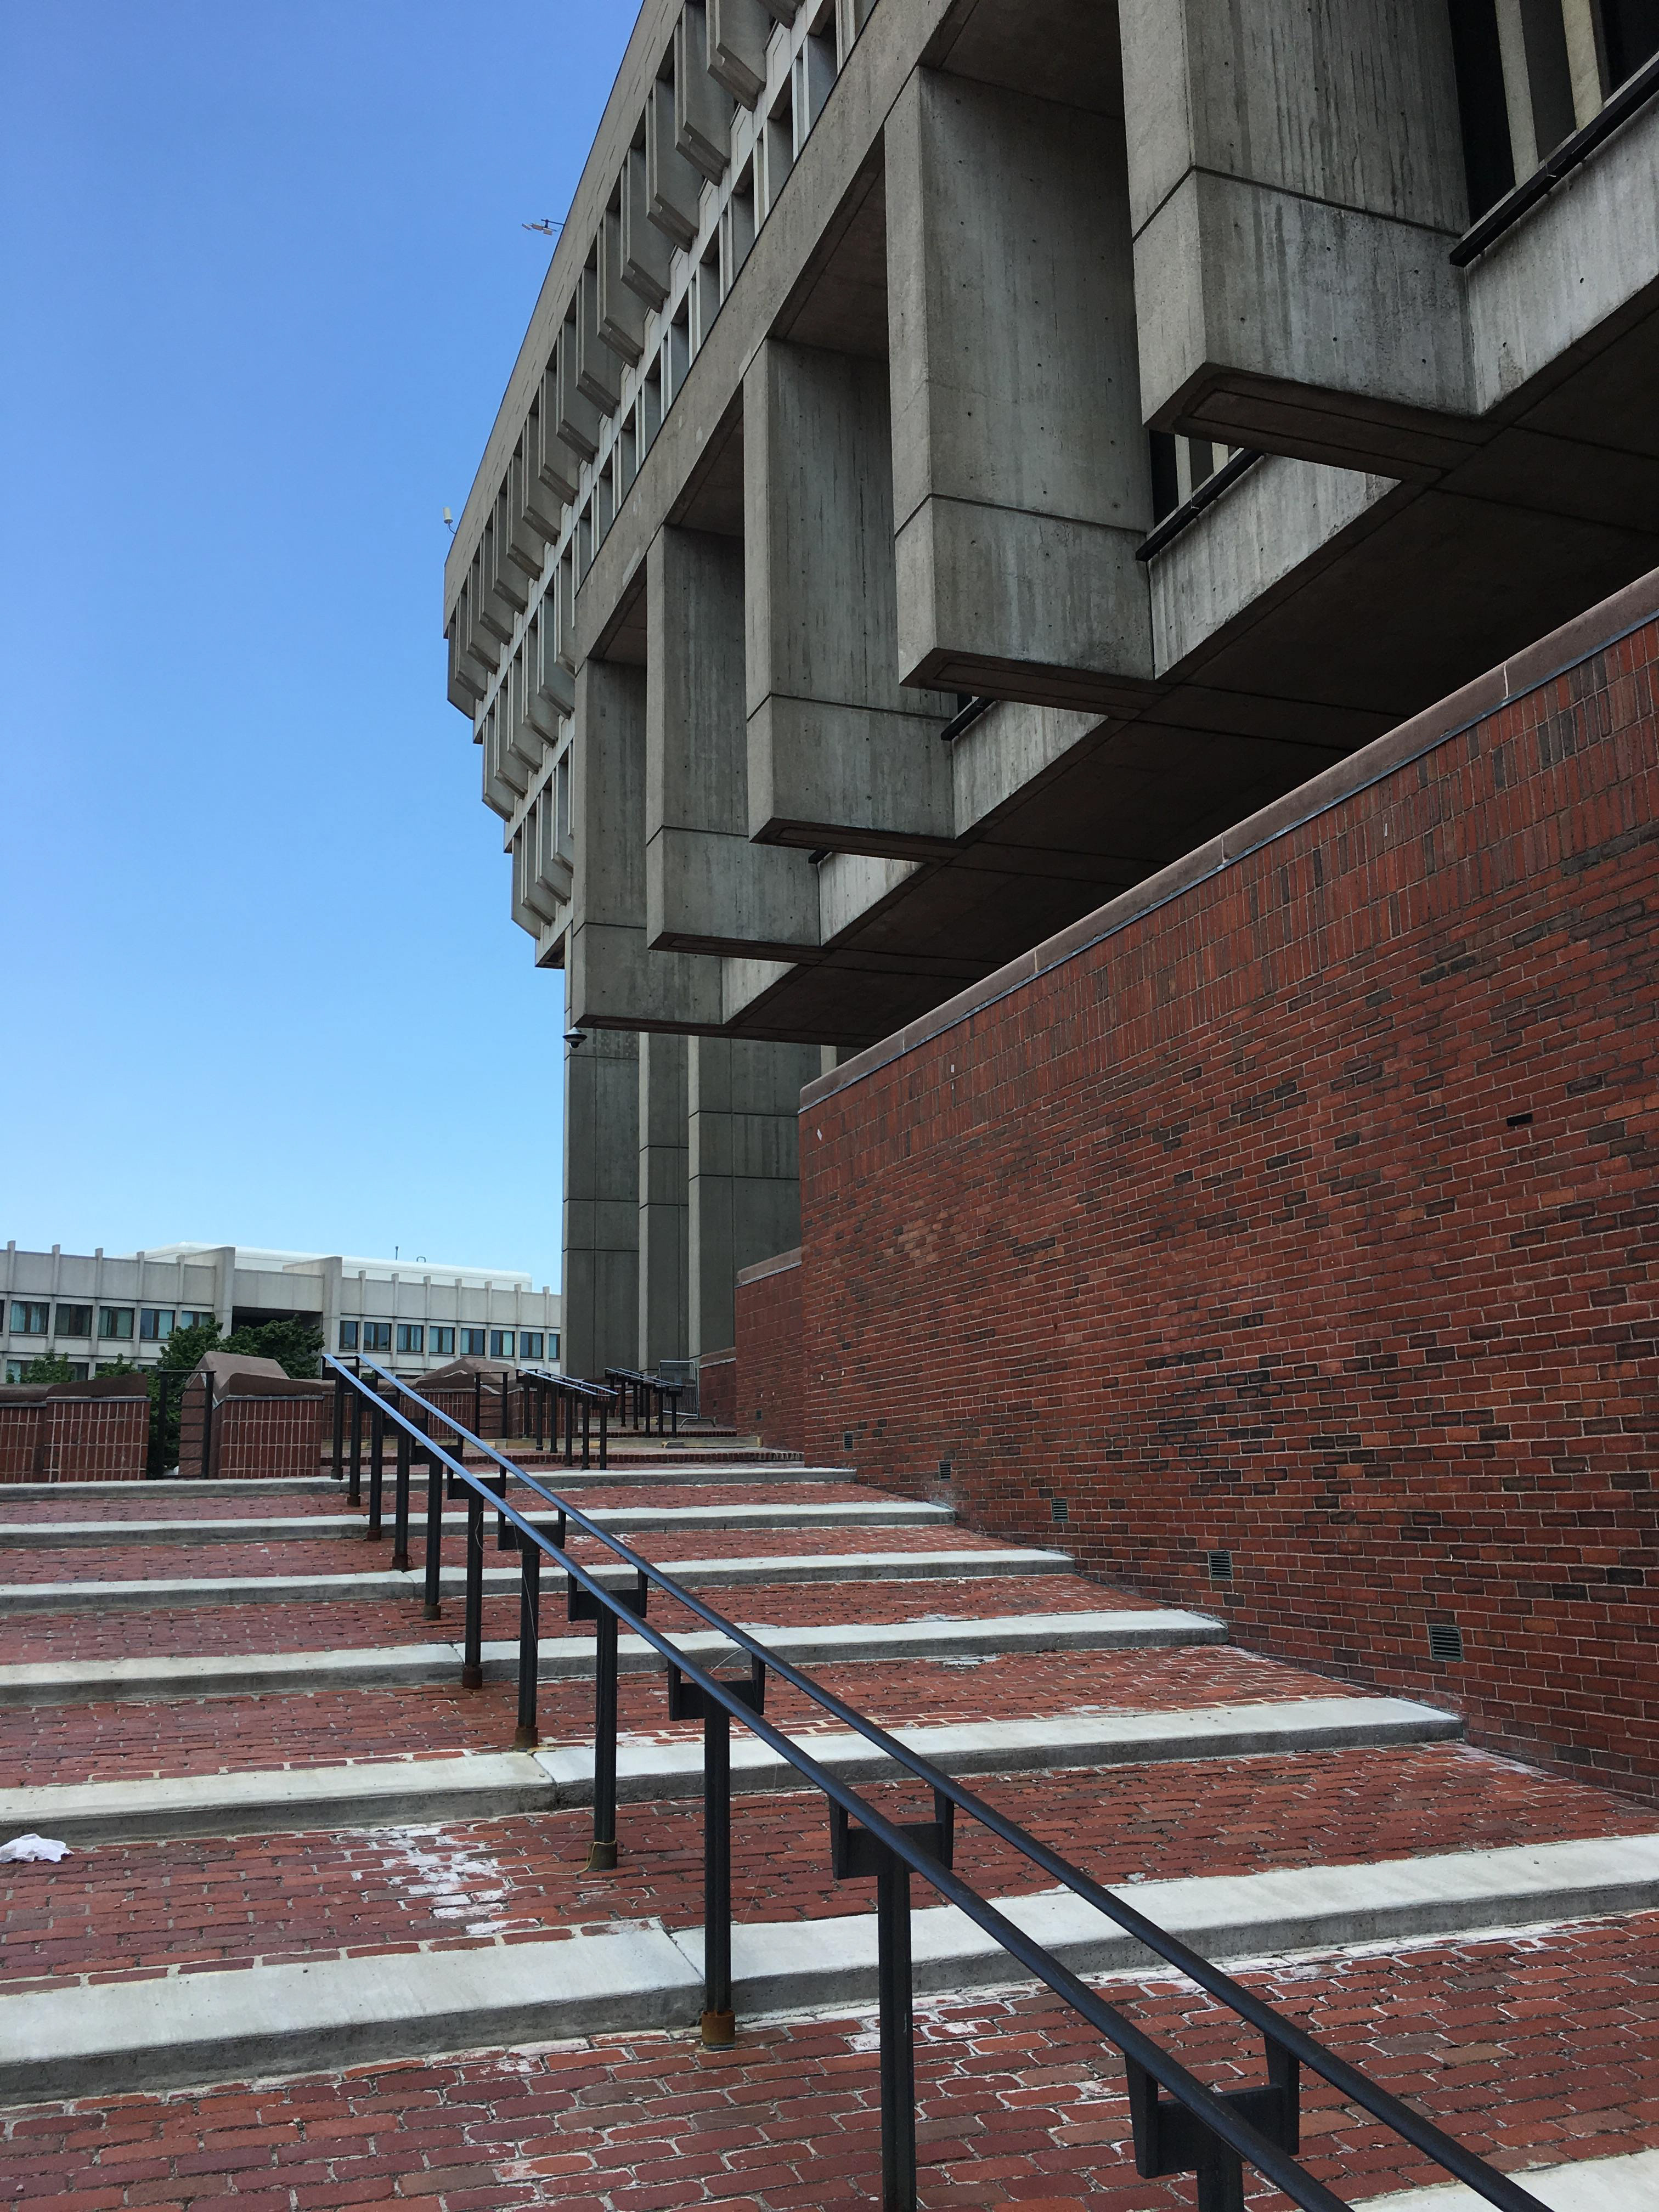
The transparency of the built street edge deals with the visual translation of activity between interior and exterior through glass and/or outdoor spaces, such as balconies or porches. This is inherently linked to the permeability of the built street edge, but specifically deals with the visual aspect, and is primarily a qualitative construct. Does the facade relate interior to exterior so that activity can be translated between the two? Kunstler expresses this point in this 2004 TED Talk with the built edge of Boston City Hall, which demonstrates a stark difference in the transparency of the build street edge from what he describes as a good public space (Kunstler 2004) .(see Figures 10 and 12). 
According to Jane Jacobs, the translation of activity from interior to exterior gives the street a sense of safety and contact essential to viable neighborhoods (J. Jacobs 55, 1961). She also states that activity simply attracts more activity (J. Jacobs 37, 1961). Translation of this activity to the public realm is transparency of the built street edge. Transparency of the Built Street Edge is illustrated in Figure 13.

FIGURE 12 - NON-PERMEABLE and NON-TRANSPARENT EDGE - BOSTON CITY HALL - Source: (author)

FIGURE 13 - TRANSPARENCY OF THE BUILT STREET EDGE - Source: drawn by author

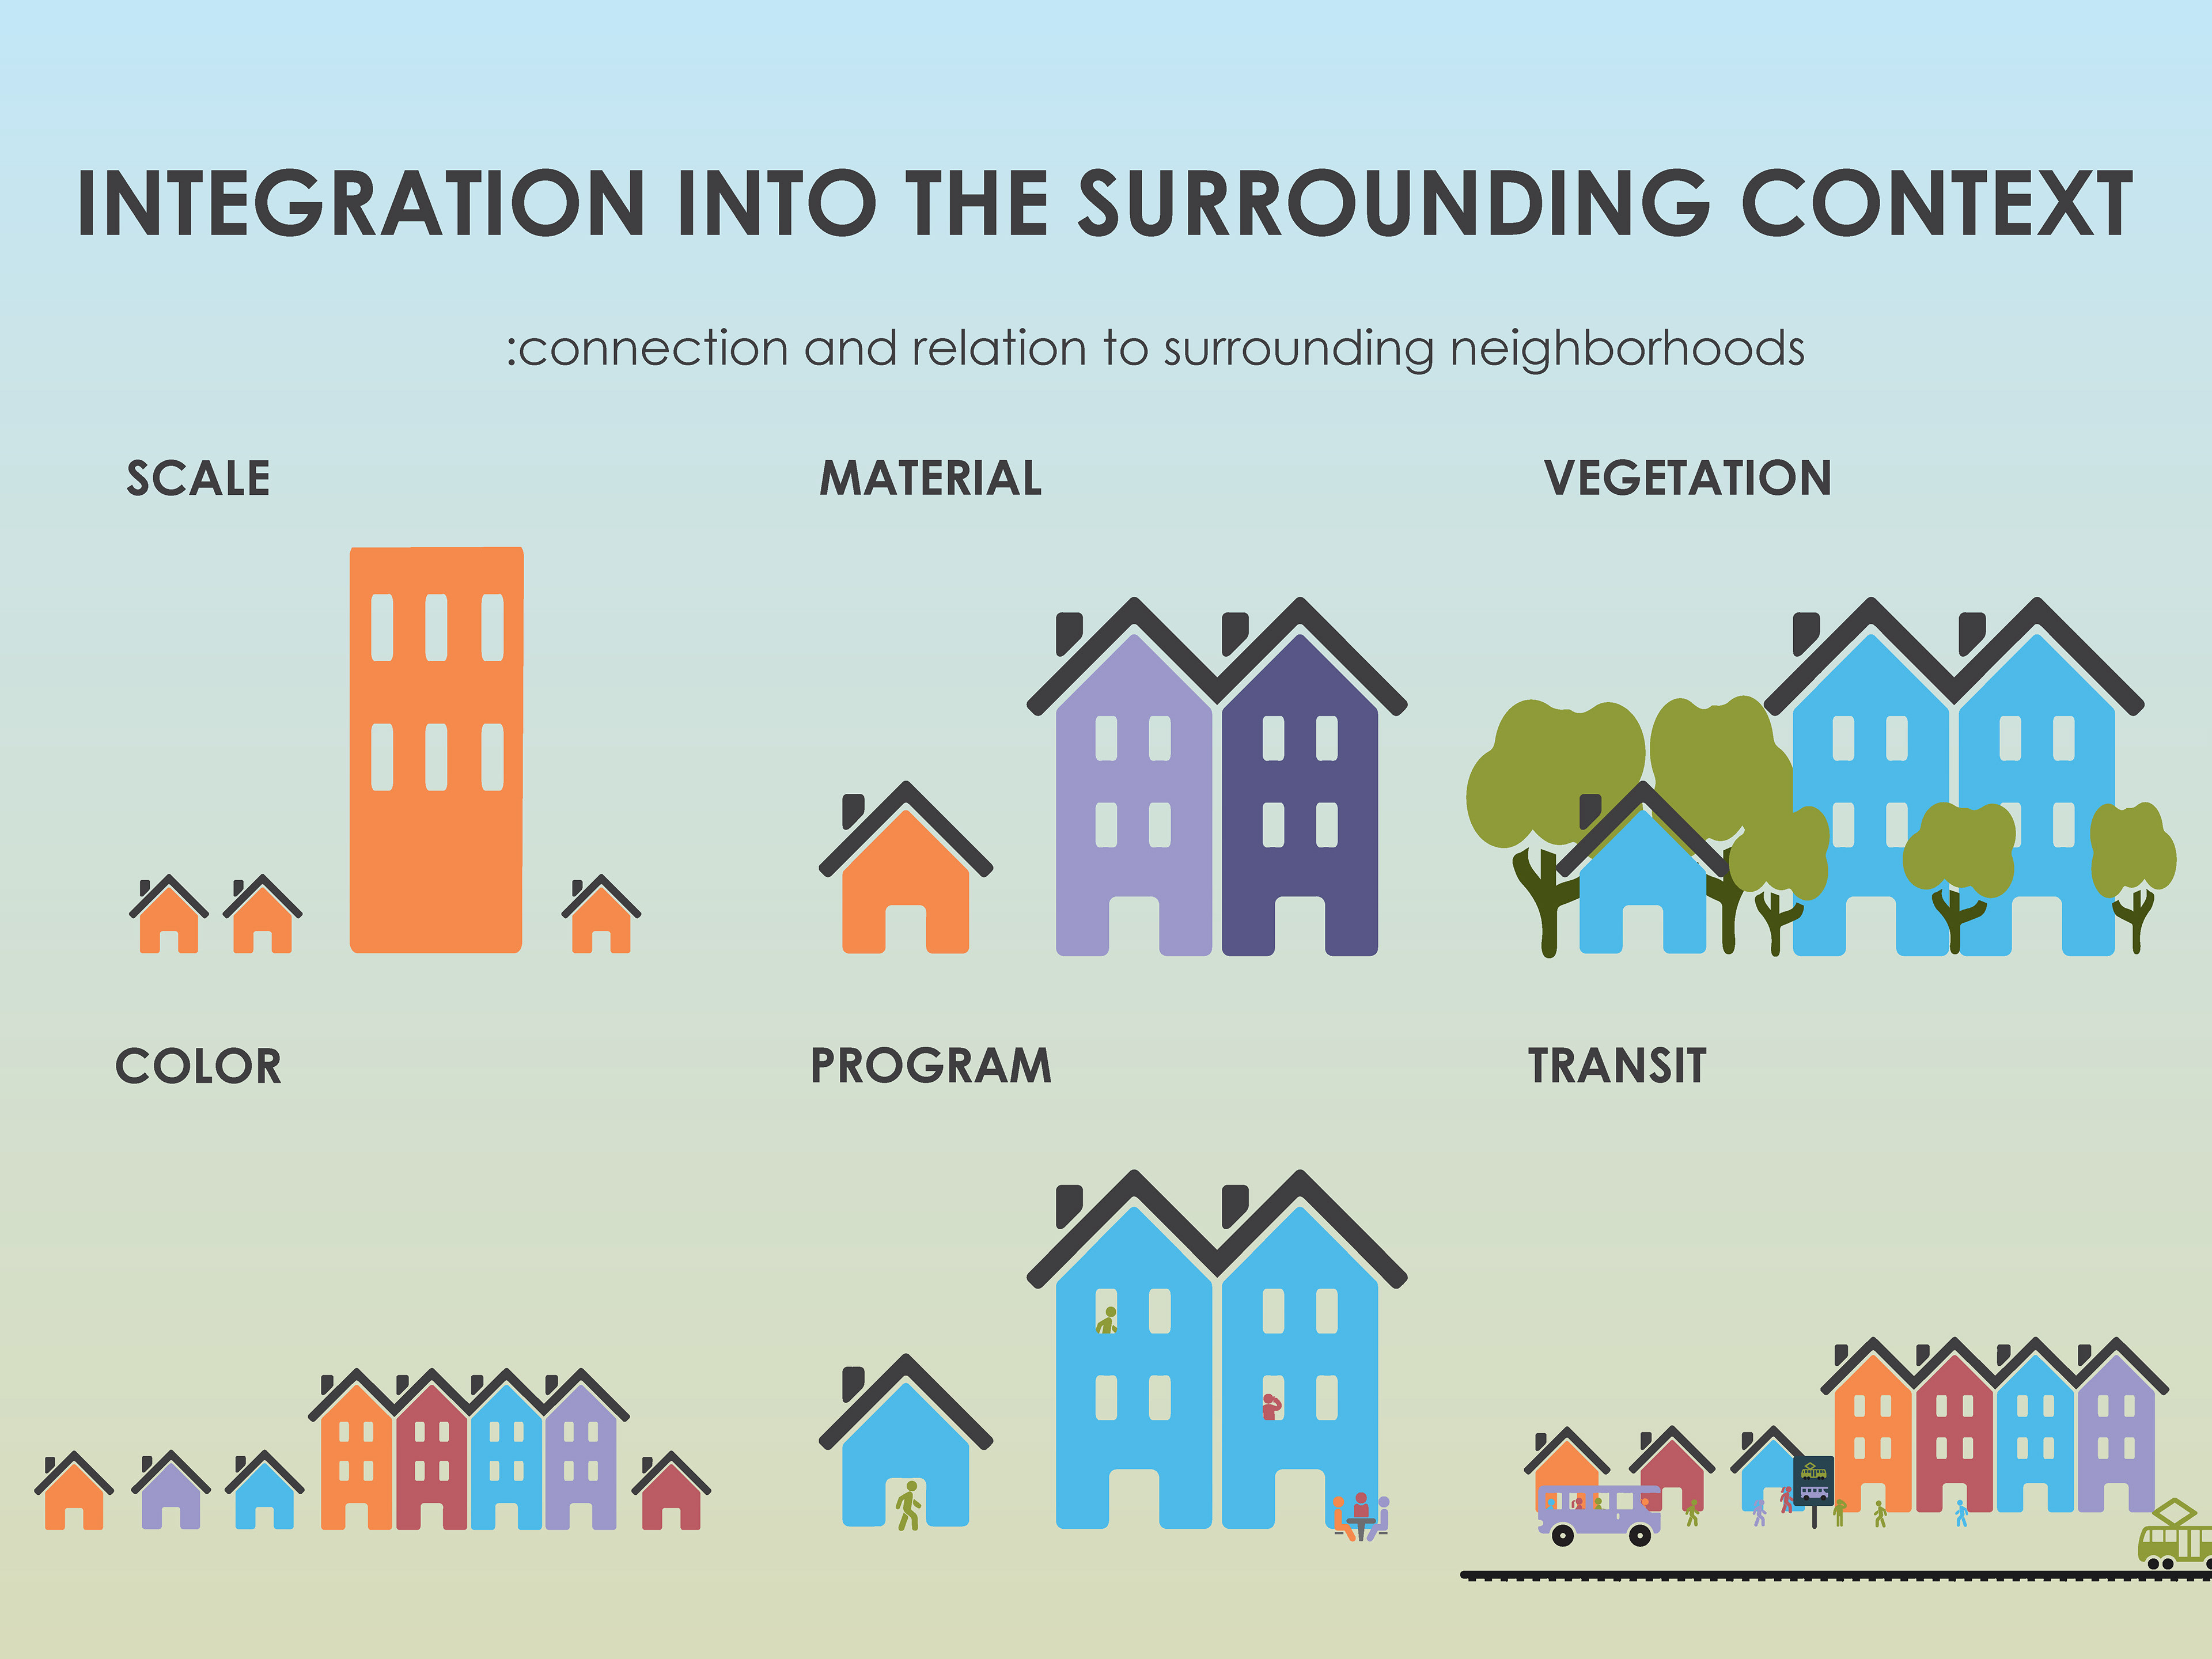
F.    Integration into Surrounding Context
: connection and relation to surrounding neighborhoods 
Integration into the greater surrounding area is crucial to the redevelopment of suburbia into walkable districts. According to Lynch, any functioning urban area has an underlying structure and identity that contain potential for imagery of a place (Lynch 115, 1960). He describes the rate of suburban development as inherently problematic due to the constant reshaping of the built environment, causing a lack of image preservation that give areas a sense of place and habitation. In a suburban context, this underlying structure is still critical to the walkability of a retrofit. An underlying structure of nodes, paths, and edges exists in any context, and a suburban retrofit offers an opportunity to expand and bring forward these existing urban qualities.
According to Dunham-Jones, integration of suburban retrofits often improves as the development matures. “Large projects increase a municipalities’ experience with mixed uses, mixed incomes, shared parking, form-based codes, context-sensitive street standards, transfers of development rights, and other regulations that encourage urban development patterns. As a result, one successful retrofit tends to breed another” (Dunham-Jones 43, 2009). 
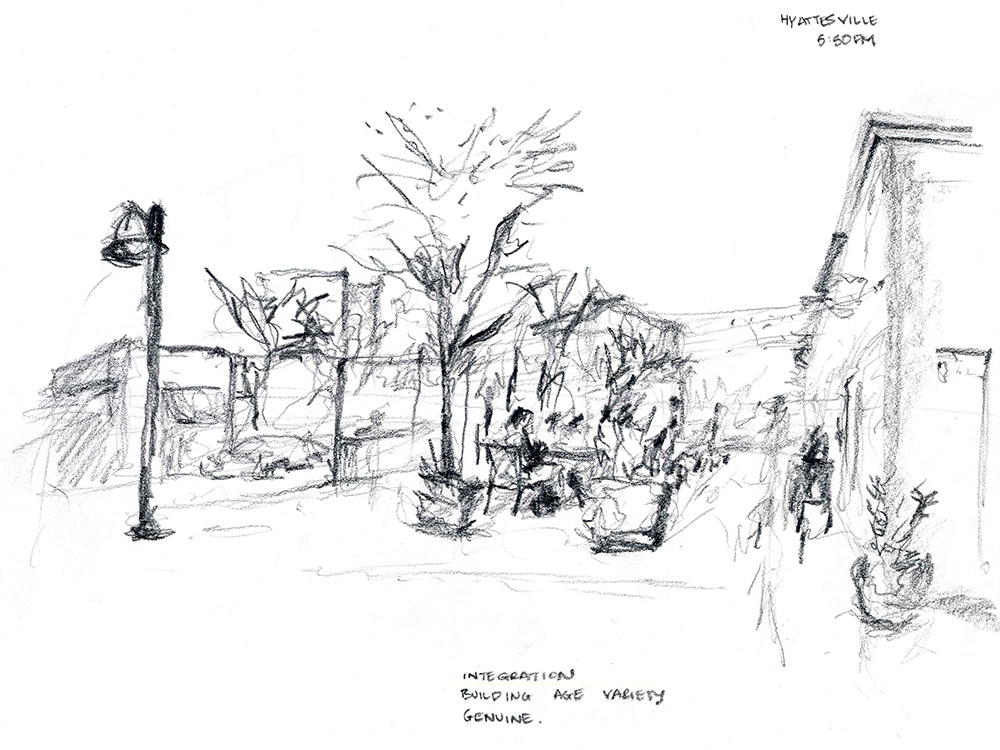
In the context of this capstone, integration refers to a qualitative assessment of connection and relation to surrounding context. Designers can use a multitude of varying tactics to integrate suburban retrofits into their surrounding contexts. These may include (but is certainly not limited to) building scale, materials, color, program, street patterns, and even tree species. This qualitative construct must be assessed on-site at the edges of the suburban retrofit. Integration into Surrounding Context is illustrated in Figure 14.

FIGURE 14 - INTEGRATION INTO SURROUNDING CONTEXT - Source: drawn by author

G.    Access – Block Size
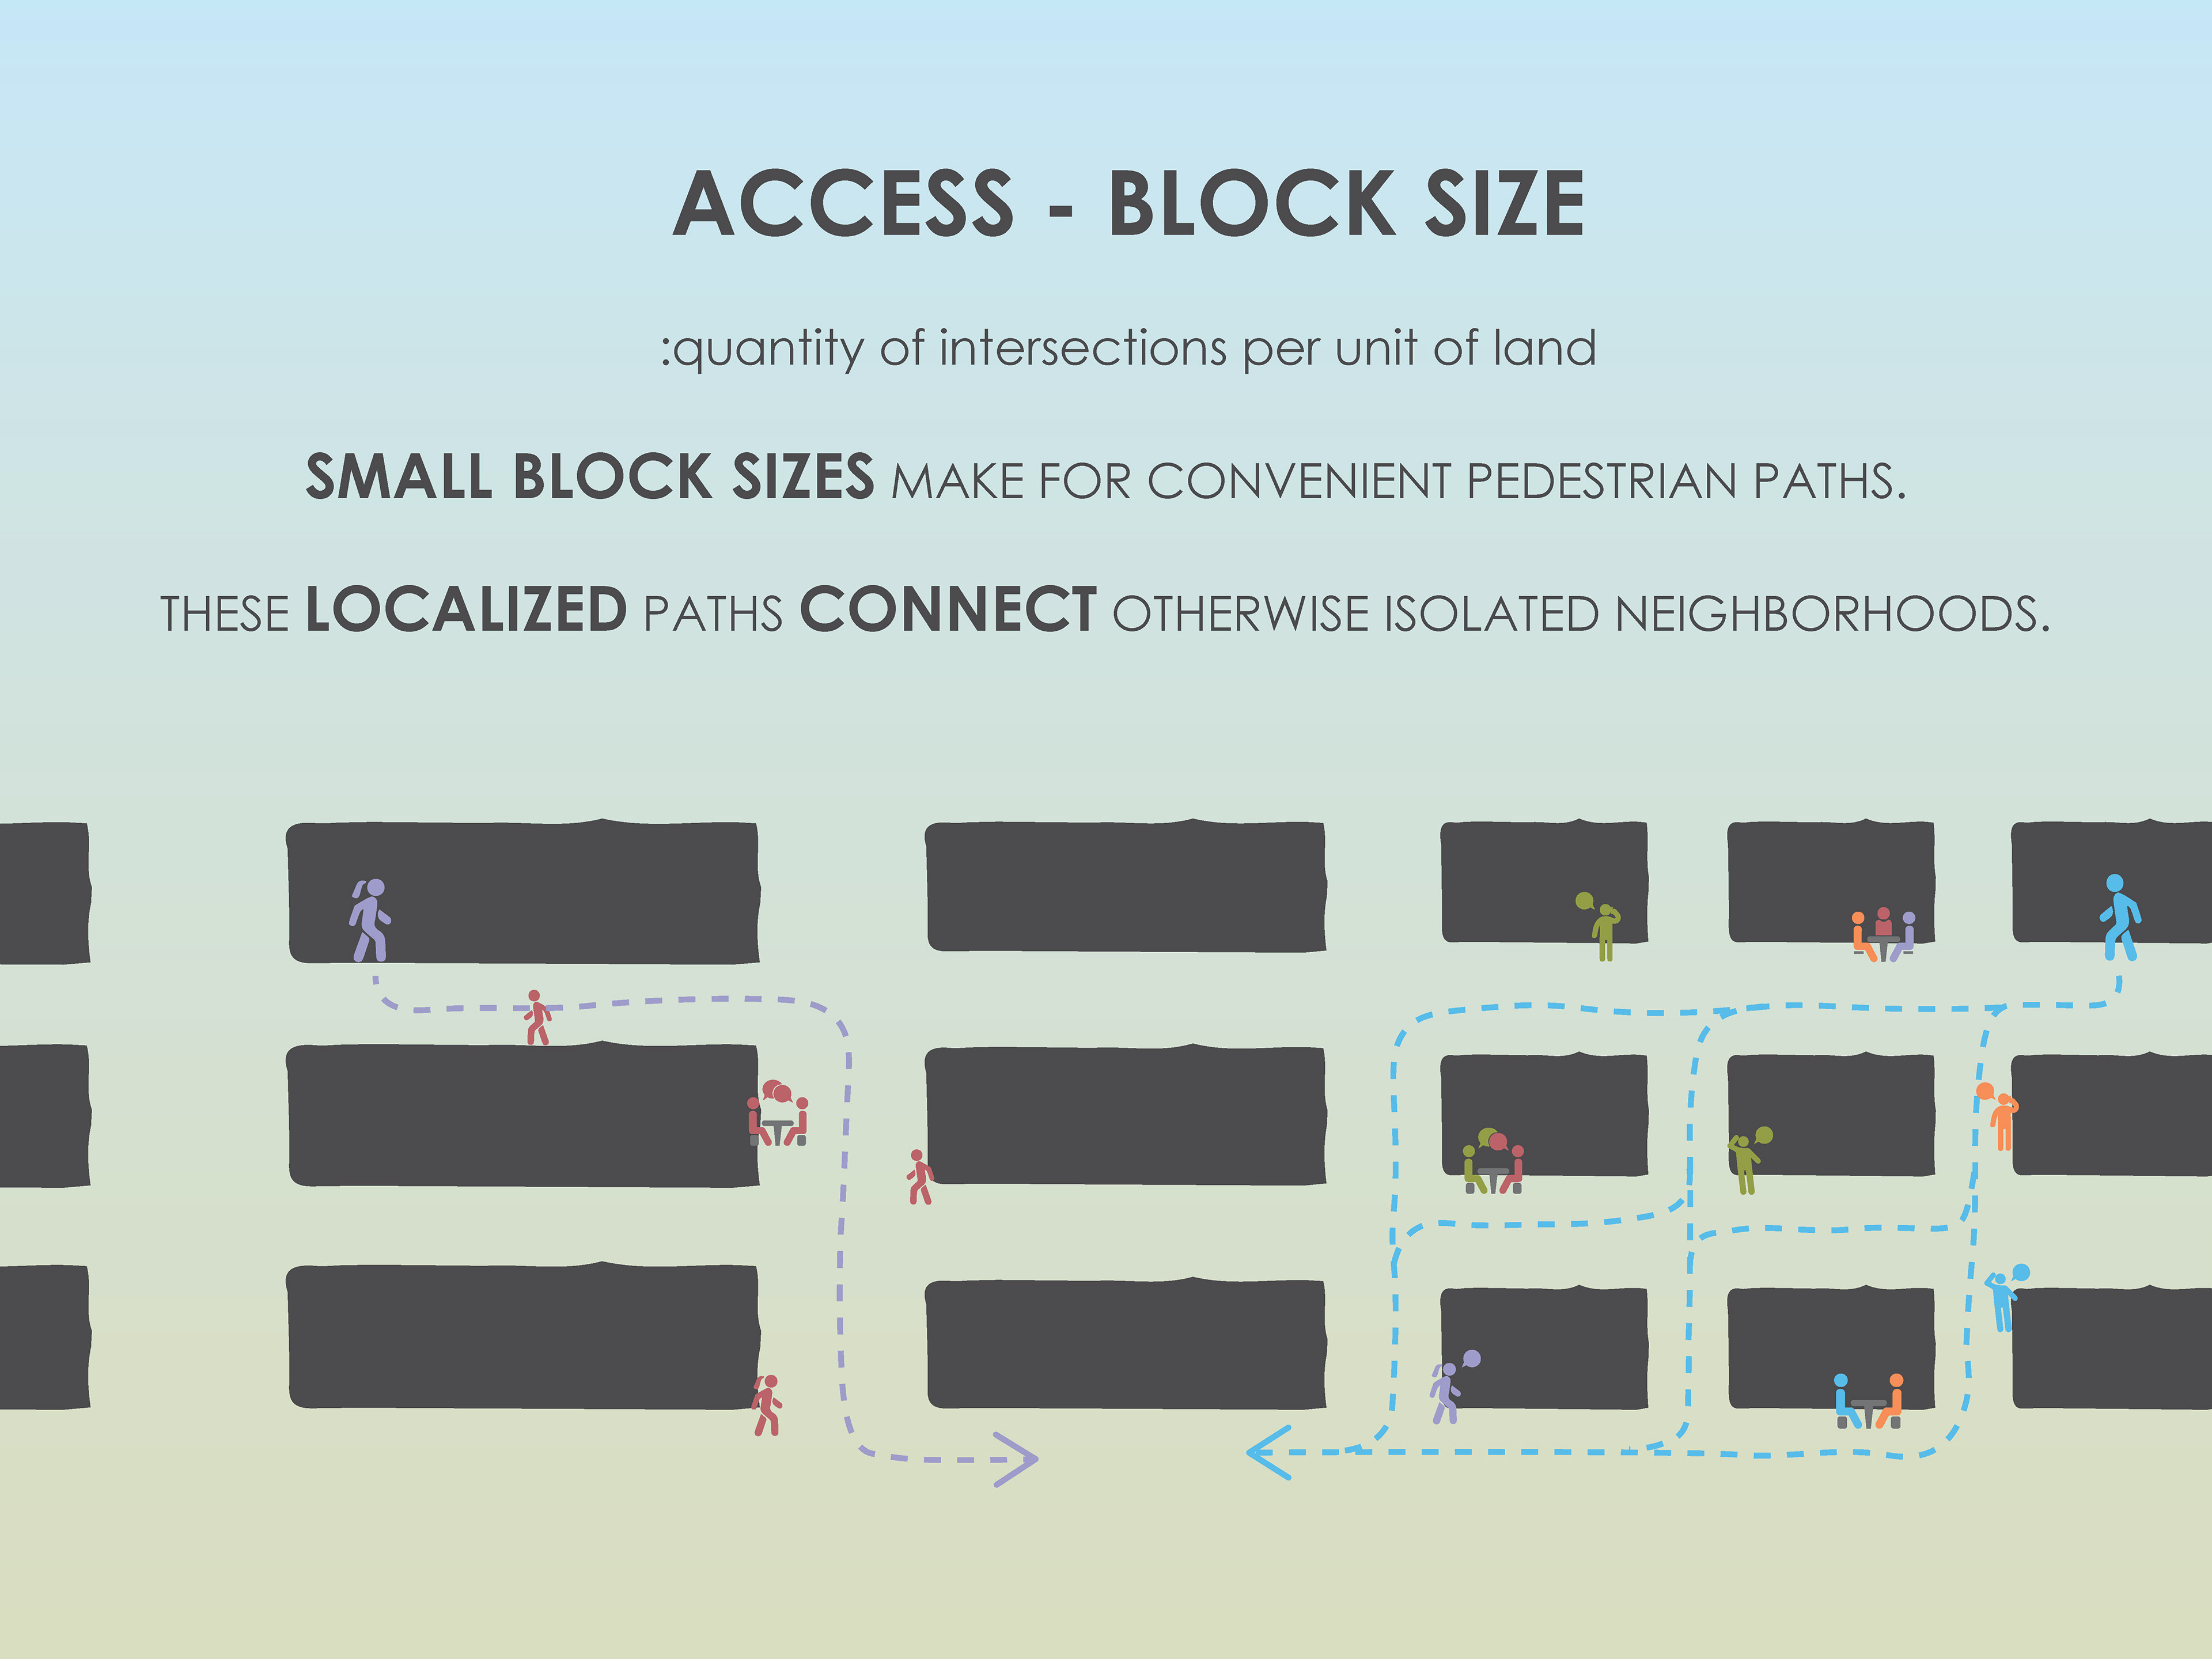
:quantity of intersections per unit of land 
Block size is the most important factor in determining walkability (Dunham-Jones 175, 2009). Small block sizes make for convenient pedestrian paths through a city, while “larger block – unless they contain pedestrian cut-throughs – significantly inhibit walkability.”
Jacobs describes the frequency of threshold as a condition for generating the diversity necessary to promote active neighborhoods, specifically in dealing with block length. “Most blocks must be short; that is, streets and opportunities to turn corners must be frequent (Jacobs 178, 1961).” She states that short blocks offer opportunities to open up and connect neighborhoods that would otherwise be isolated to one another, connected only via massive thoroughfares. This is a matter of economics and convenience according to Jacobs. She states, “[Activity-driving entities such as] small stores can and do flourish in extraordinary numbers and incidence in lively districts of cities because there are enough people to support their presence at short, convenient intervals… (J. Jacobs 147, 1961).” Jacobs calls for short block intervals as a response to this observation and says that when convenience is lost in cities, the small and personal connections that are vital to public activity wither away.
Frequency of thresholds can be measured by quantifying the number of intersections within a district. The greater the number of intersections, the smaller the average block size. For example, comparing the number of intersections of Venice, Italy (one of the most walkable cities in the world) with the number of intersections in a standard suburban commercial district, the distinction of quantity of intersections would be clear (A. Jacobs 262, 1993). Access is illustrated in Figure 15.

FIGURE 15 - ACCESS - BLOCK SIZE - Source: drawn by author

H.    Diversity of Building Age
: building mean age and range of age within a certain area
The diversity of building age and repair are essential to the generation of active streets (J. Jacobs 188, 1961). This is a matter of economics and program. High costs of new construction lead to higher rents and thus well-established businesses and highly subsidized enterprises are the only potential occupants. Meanwhile, generators for activity, such as “neighborhood bars and good bookstores,” are left to occupy older buildings. Without affordable places to do business, these programs are pushed out of an area, decreasing the activity of the street. This construct of walkability promotes an incremental approach to suburban retrofits in which existing buildings are integrated into new development, rather than a clearing and clean slate approach. Diversity of Building Age is illustrated in Figure 16.

FIGURE 16 - DIVERSITY OF BUILDING AGE - Source: drawn by author

I.    Diversity of Program 
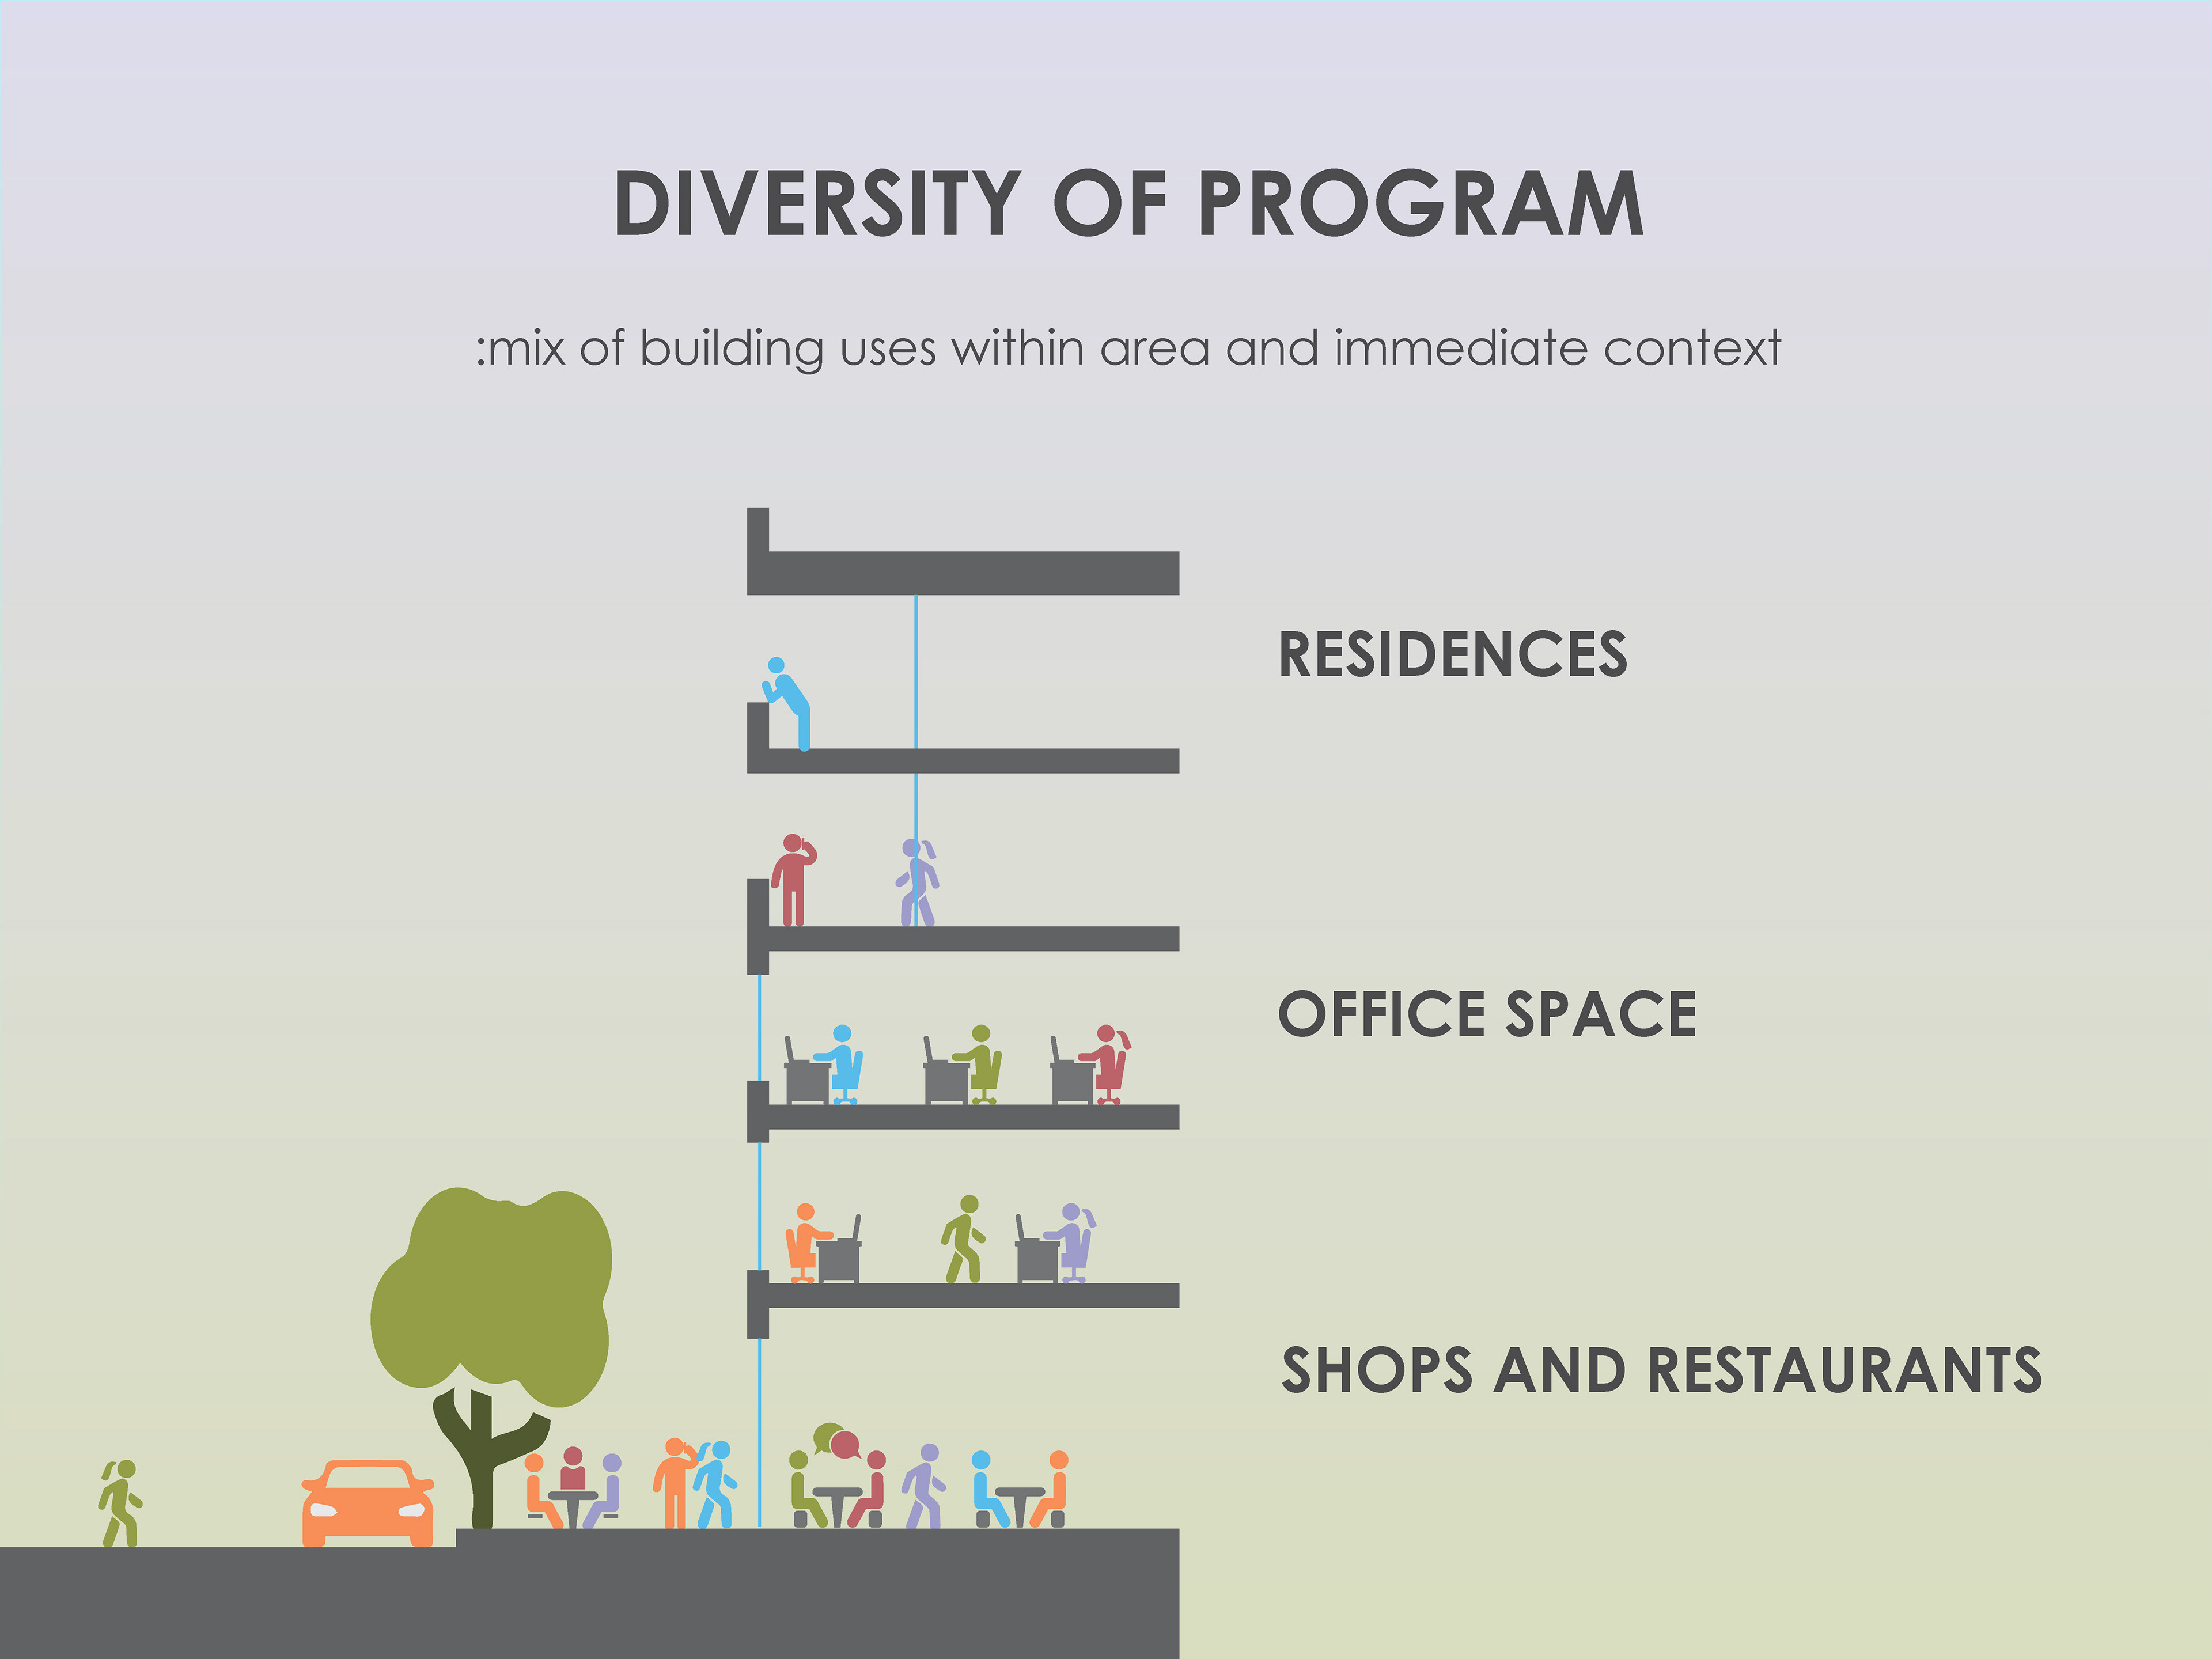
: mix of building uses within retrofit and immediate context
Jane Jacobs says that building uses must have enough variety to sufficiently sustain public activity. In other words, residences must have all necessary goods and services as well as entertainment opportunities within a walkable (or transitable) distance to promote public contact essential to the life of the city. In The Death and Life of Great American Cities, she states, “Commercial diversity is, in itself, immensely important for cities, socially as well as economically. …A city district with an exuberant variety and plenty in its commerce… [often] contains a good many other kinds of diversity also, including variety of cultural opportunities, variety of scenes, and a great variety in its population and other users” (Jacobs 148, 1961).
According to Allan Jacobs, program diversity can be directly translated to building diversity along a street (Jacobs 297, 1993). The more buildings along a street, the more opportunities for building variety that caters to a mix of uses. This diversity of uses attracts mixes of people that build communities. A higher number of building owners leads to differences in building maintenance, color, and landscape that often gives a neighborhood a more diverse and rich culture. Diversity of Program is illustrated in Figure 17.

FIGURE 17 - DIVERSITY OF PROGRAM - Source: drawn by author

2.1.    WALKABILITY OF THE AMERICAN SUBURBS
The current structure of suburbs has proven unsustainable in regard to environmental, social or economic outputs. Most contempo­rary architectural and urban theorists agree that the suburban condition is inherently problematic. The problematic state of the suburban built condition has caused numerous negative impacts, including dependence on the vehicle, environmental costs, transportation costs, and even increased obesity rates (Dunham-Jones 2010). Because the suburbs comprise the majority of our “urbanized” areas, it is important that designers are able to rectify this American man-made landscape.
This capstone seeks to make two main contributions: First, synthesize some of sustainable impacts of walkability and, second, building upon previous research, develop a series of infographics which can be used for advocacy purposes for a wide audience. This project involves illustrating the constructs of walkability as synthesized through the writings of architects and urban theorists. These infographics can be used for public displays and are meant to quickly and efficiently send a strong message related to walkability. The graphics are designed using recognizable icons meant to give life and humor to the drawings. The definition of each construct is shown on the graphics and a brief explanation and/or labels to assist in understanding. Below is a list of each of the constructs of walkability and their respective definitions.
DENSITY OF DWELLING UNITS
    :quantity of dwelling units per unit of land
DENSITY OF BUILT FORM
    :ratio/percentage of built space versus non-built space in a figure-ground study
DEFINITION OF PUBLIC SPACE
    :qualitative assessment of spatial definition
PERMEABILITY
    :quantity of thresholds per unit of distance of the built street edge
    :qualitative condition of thresholds and activity ‘in and out’ along the built street edge
TRANSPARENCY
    :visual connection between interior activity and exterior activity
INTEGRATION
    :connection and relation to surrounding neighborhoods
ACCESS
    :quantity of intersections per unit of land
DIVERSITY OF BUILDING AGE
    :building mean age and range of age within a certain area
DIVERSITY of PROGRAM
    :mix of building uses within area and immediate context
Each of these constructs are critical to the walkability of built form. Each construct is diagrammed in a way that can be quickly and easily understood. These graphics are meant to be accessible to a wide audience outside of the fields of architecture, urban design, and urban theory. They can be used as a tool for design, advocacy, and outreach in order to build a greater understanding of what walkability means to a community. With an increased understanding and concern for walkability in the public view, places in the suburbs of the United States can begin to urbanized into pockets of desirable walkable nodes, increasing investments into the community. Places worth caring about, such as Bethesda Row in Bethesda, Maryland (see Figure 18), will emerge throughout the country, forging a path to a sustainable and vibrant future. 

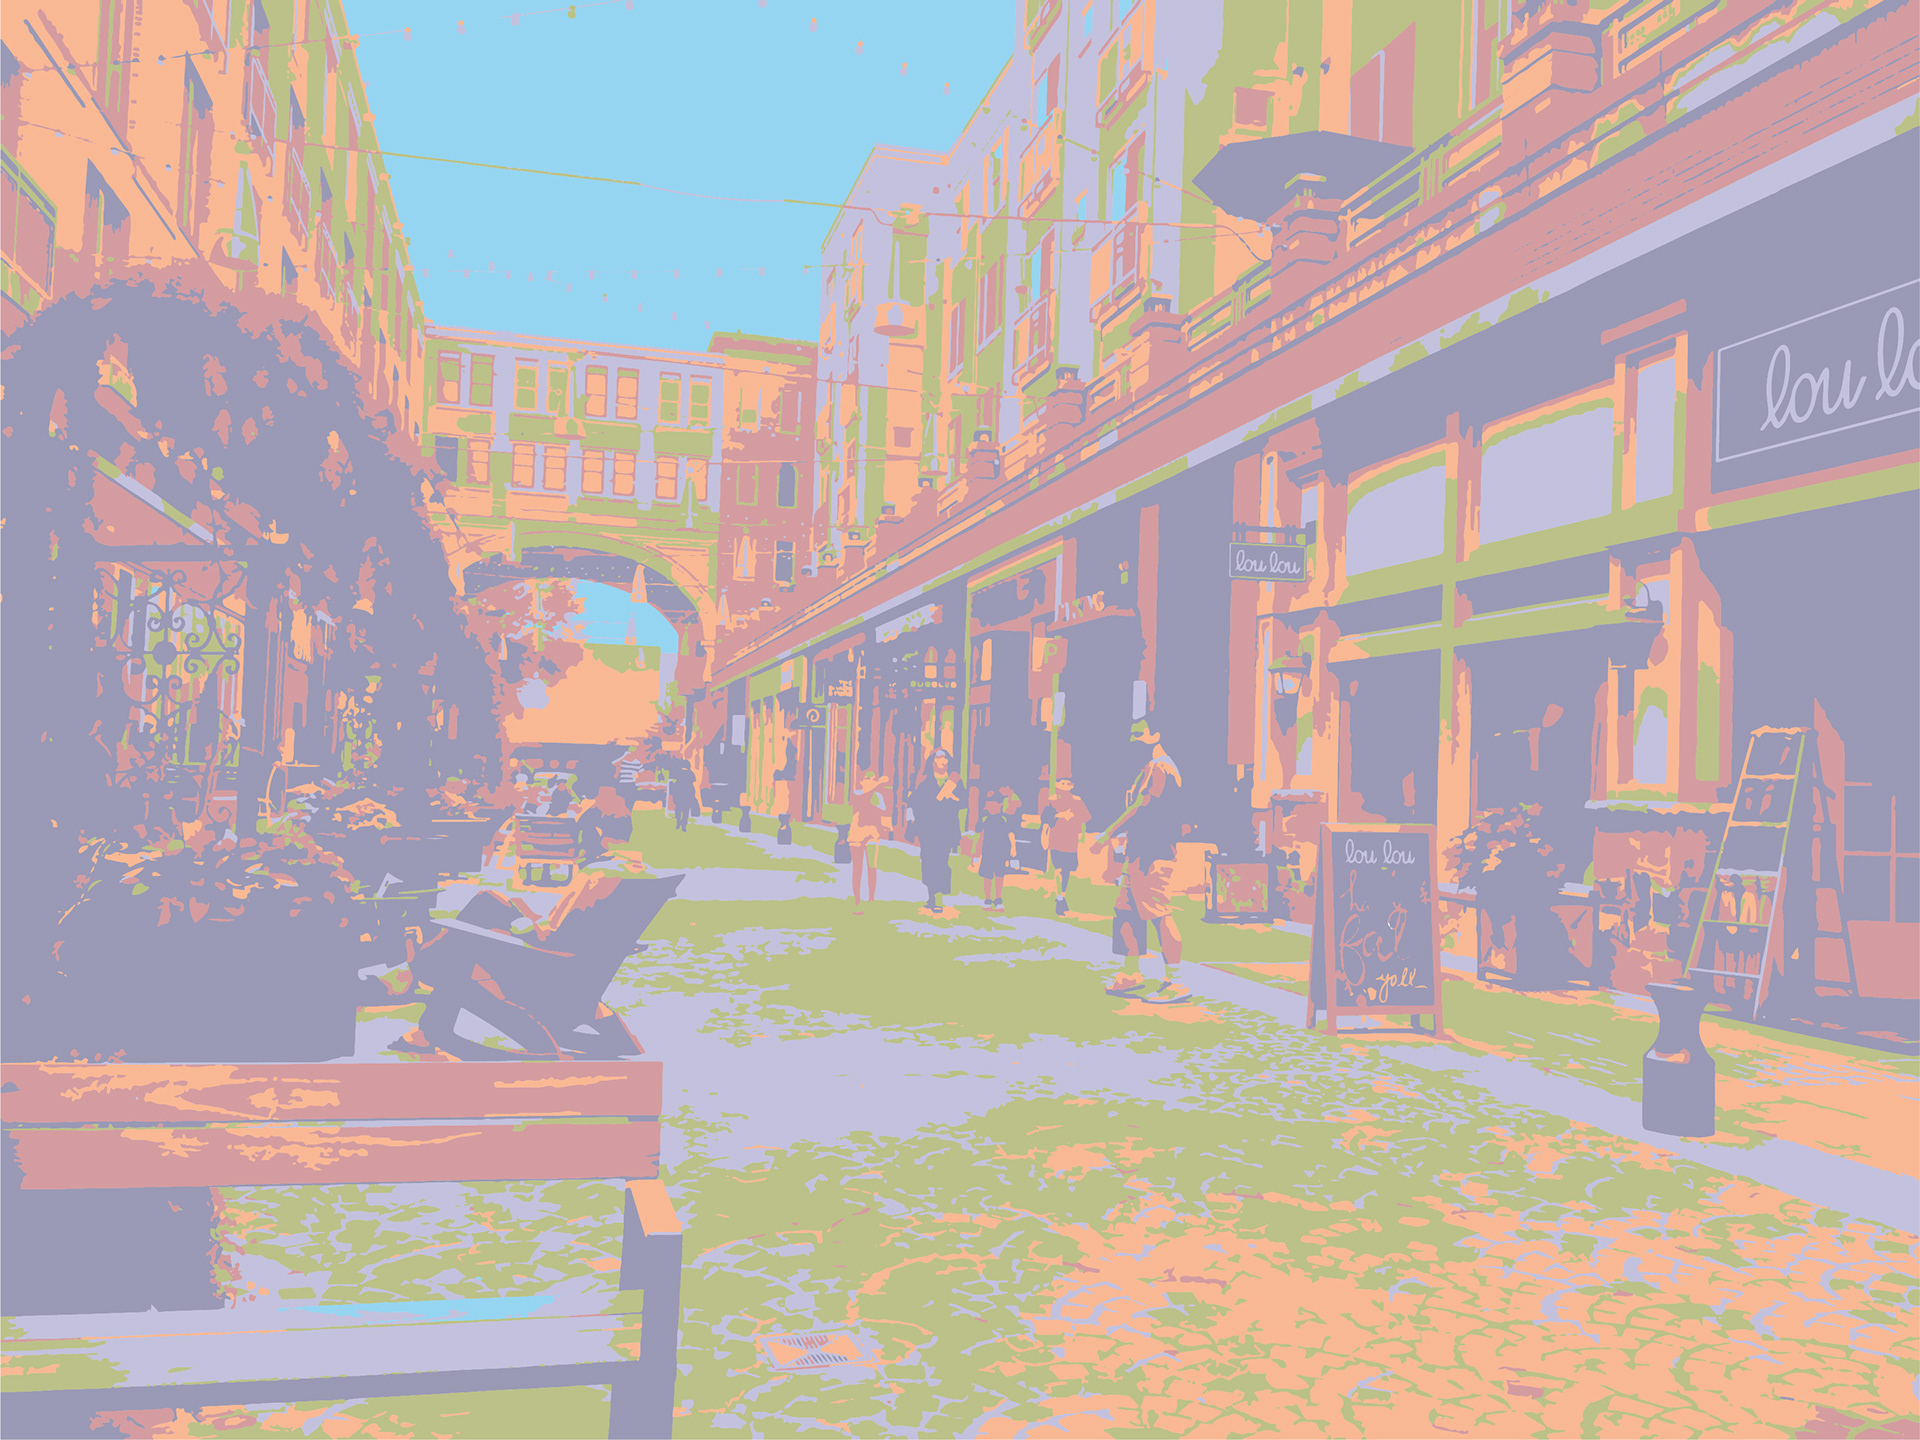
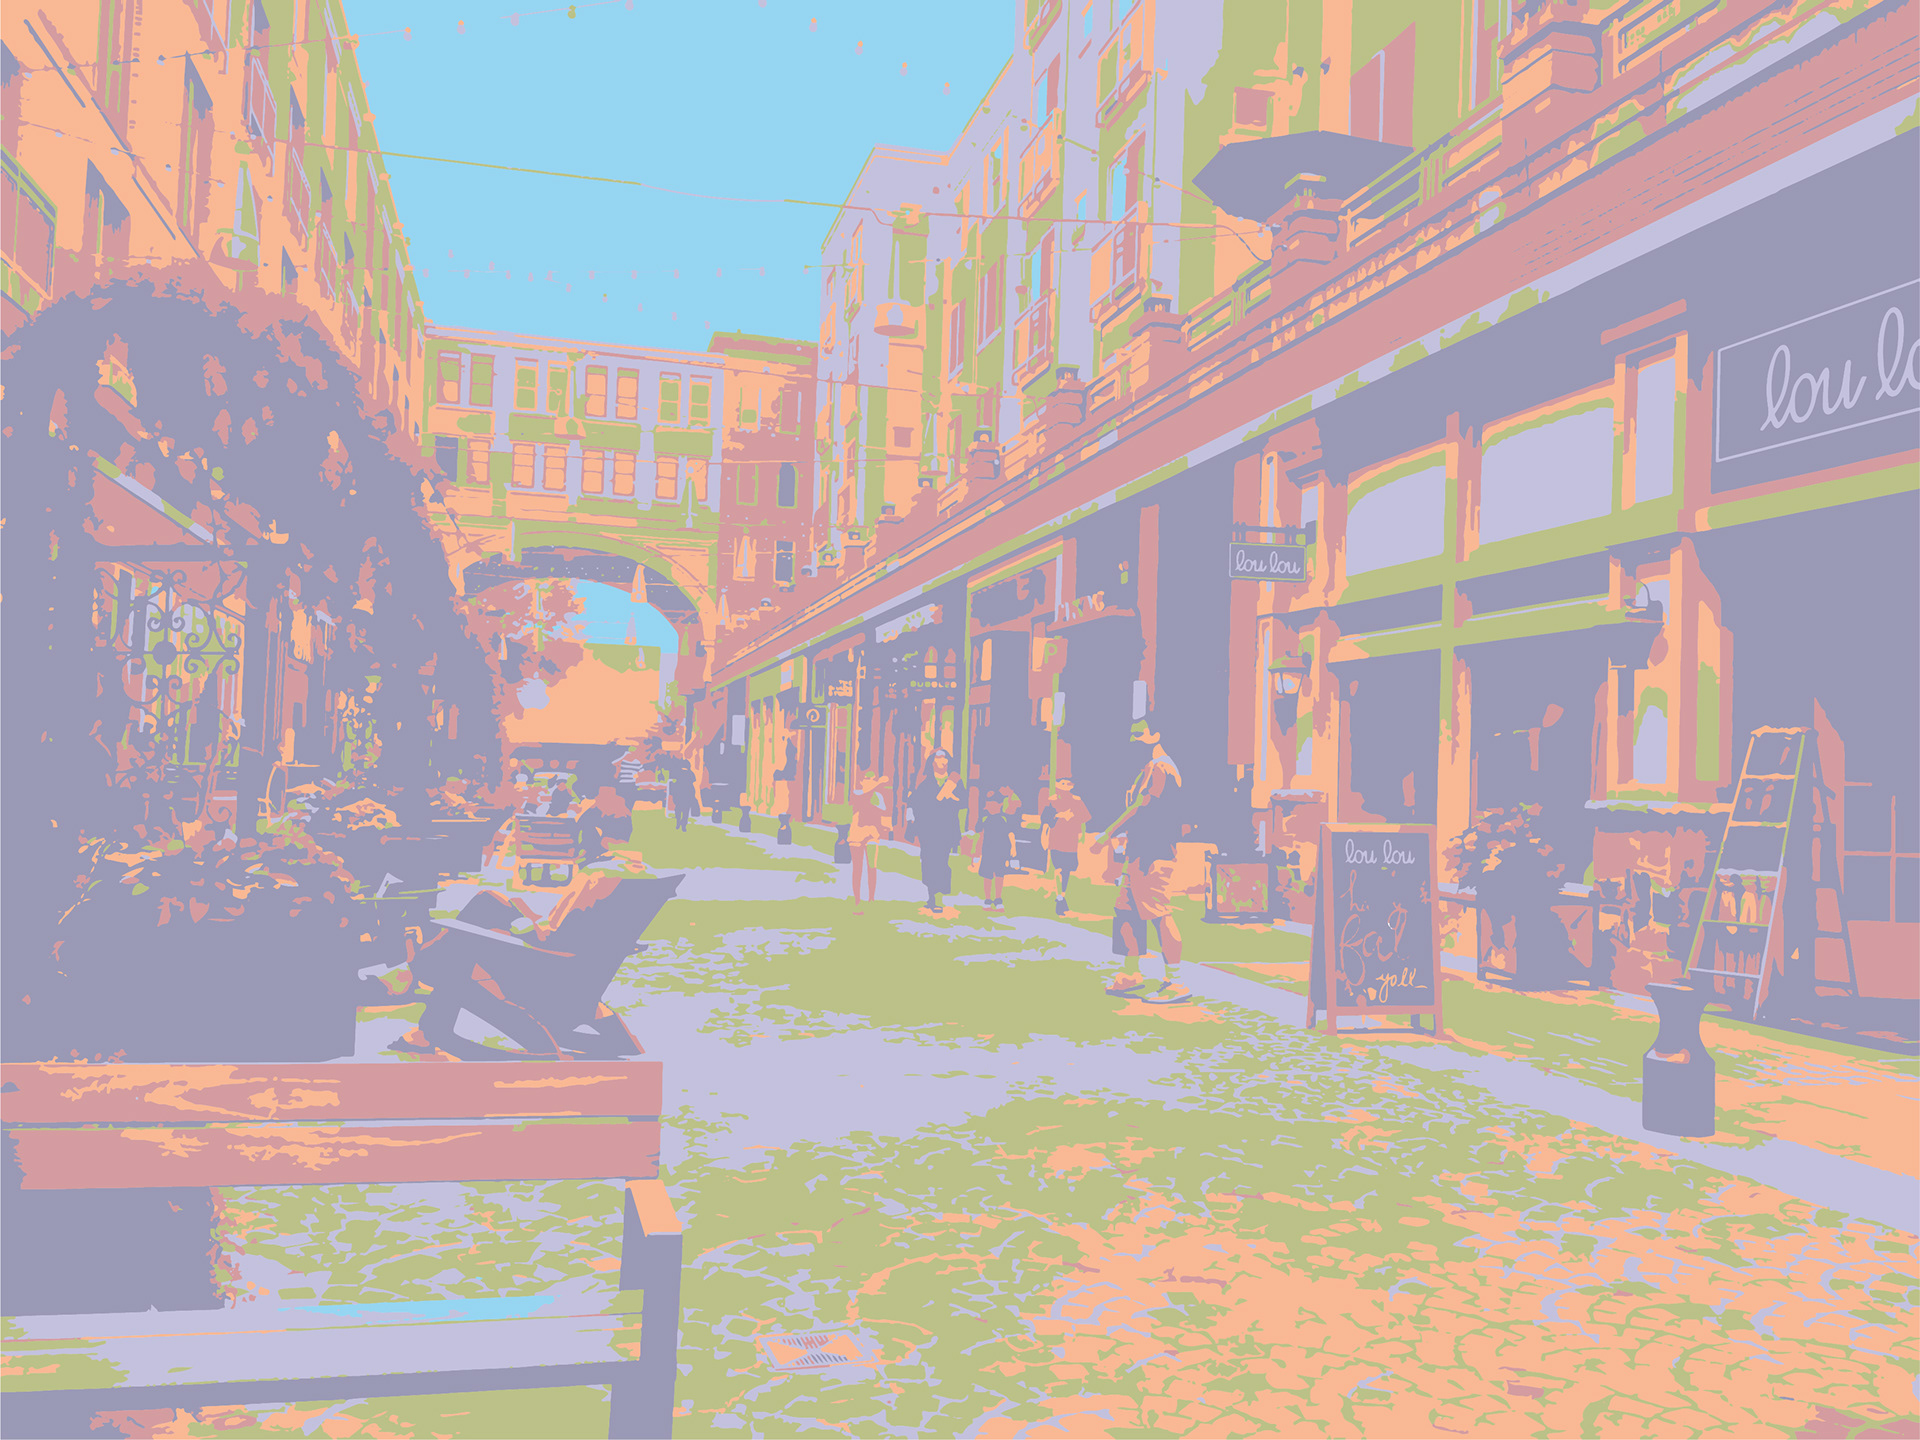
FIGURE 18 - BETHESDA ROW SUBURBAN RETROFIT - Source: drawn by author

The above image is a photo of Bethesda Row in Bethesda, Maryland. Originally an industrial district, the site has been retrofitted into a mixed-use walkable district. The project is highly regarded by the public and has won numerous awards.
5.    REFERENCES

Adler, Ben. “Joel Kotkin Thinks You Want to Live in Houston. Here’s Why You Don’t.” Grist, 19 Aug. 2014, grist.org/cities/joel-kotkin-thinks-you-want-to-live-in-houston-heres-why-you-dont/. 

Almukhtar, Sarah, et al. “Mapping the Devastation of Harvey In Houston.” The New York Times, The New York Times, 28 Aug. 2017, www.nytimes.com/interactive/2017/08/28/us/houston-maps-hurricane-harvey.html.

Arce, Rodrigo Perez de. “Urban Transformations: Rodrigo PéRez De Arce:” Urban Transformations: Rodrigo PéRez De Arce: Architectural Association, 1980, pp. 238–266. 

Badger, Emily. “Is Houston Still a Model City? Its Supporters Aren’t Backing Down.” The New York Times, The New York Times, 4 Sept. 2017, www.nytimes.com/2017/09/04/upshot/is-houston-still-a-model-city-its-supporters-arent-backing-down.html. 

Beauregard, Robert A. “FRom Place to Site: Negotiating Narrative Complexity.” In Site Matters, 40-58. 1st ed. New York, NY: Routledge, 2004.

Benfield, Kaid. “The Country’s Best Suburban Retrofit: Bethesda Row Reaches Maturity.” Kaid Benfield Archiive. January 28, 2010. Accessed November 24, 2018. https://kaidbenfieldarchive.com/20100128-the-country-s-best-suburban-retrofit-bethesda-row-reach.html.

“Bethesda Row.” Cooper Carry. Accessed November 25, 2018. https://www.coopercarry.com/projects/bethesda-row/.

Beyer, Scott. “OPINION | Don’t Blame Houston’s Lack of Zoning for Harvey Flooding.” TheHill, 5 Sept. 2017, thehill.com/blogs/pundits-blog/state-local-politics/349021-opinion-dont-blame-houstons-lack-of-zoning-laws-for. 

Greater Boston Convention and Vistors Bureau. “Café Pulse - Faneuil Hall Marketplace.” Boston Guide | Hotels, Restaurants, Meetings & Things to Do in Boston. 2018. Accessed December 09, 2018. https://www.bostonusa.com/listings/café-pulse-faneuil-hall-marketplace/15621/.

Cameron, Darla, et al. “Flooding after Harvey: How Bad Is It, How Bad Will It Get, and When Will It End?” The Washington Post, WP Company, 29 Aug. 2017, www.washingtonpost.com/graphics/2017/national/harvey-impact/.

“Create Walkable Neighborhoods: Bethesda Row, Bethesda, Maryland.” EPA. March 21, 2017. Accessed November 25, 2018. https://www.epa.gov/smartgrowth/create-walkable-neighborhoods-bethesda-row-bethesda-maryland.

“Data Downloads.” Montgomery Planning, Mongomery County Planning Department, 22 Mar. 2017, montgomeryplanning.org/tools/gis-and-mapping/gis-data/data-downloads/.

Duany, Andres, et al. Suburban Nation: the Rise and the Decline of the American Dream. North Point Press, 2001.

Dunham-Jones, Ellen, and June Williamson. Retrofitting Suburbia: Urban Design Solutions for Redesigning Suburbs. Hoboken, NJ: Wiley, 2009.

Dunham-Jones, Ellen. “Retrofitting Suburbia.” TED: Ideas worth Spreading. January 2010. Accessed October 16, 2018. https://www.ted.com/talks/ellen_dunham_jones_retrofitting_suburbia. 

Fainstein, Susan S. “Postwar Approaches.” Encyclopædia Britannica, Encyclopædia Britannica, Inc., 12 May 2016, www.britannica.com/topic/urban-planning/Postwar-approaches#ref910636. 

“GIS Mapping Services.” Fairfax County Virginia, County of Fairfax Virginia, www.fairfaxcounty.gov/maps/open-geospatial-data.

“GIS Open Data Portal.” GIS Open Data, Planning Department of Prince George’s County Maryland, gisdata.pgplanning.org/opendata/.

“Growing Space-Time - PICK UP STICKS.” The Content Is the Cargo, cargocollective.com/pickupsticks/Growing-Space-Time.

Guerra, Erick, and Robert Cervero. “Mass Transit & Mass: Densities Needed to Make Transit Investments Pay Off.” UCTC Policy Brief 2011-02, 2011, uctc.berkeley.edu/research/briefs/UCTC-PB_2011-02.pdf. 

Jacobs, Allan B. Great Streets. Cambridge, MA: MIT, 1993.

Jacobs, Jane. The Death and Life of Great American Cities. New York, NY: 1961.

Kolko, Jed. “How Suburban Are Big American Cities?” FiveThirtyEight. December 30, 2015. Accessed October 16, 2018. https://fivethirtyeight.com/features/how-suburban-are-big-american-cities/. 

Kotkin, Joel. The Human City: Urbanism for the Rest of Us. B2 Books, an Agate Imprint, 2016.

Kunstler, James Howard. The Geography of Nowhere: The Rise and Decline of Americas Man-made Landscape. New York: Simon & Schuster, 1994. 

Kunstler, James Howard. “Transcript of “The Ghastly Tragedy of the Suburbs”.” TED: Ideas worth Spreading. February 2004. Accessed October 21, 2018. https://www.ted.com/talks/james_howard_kunstler_dissects_suburbia/transcript. 

Lynch, Kevin. The Image of the City. MIT Press, 1960. 

Millard, David R. “Mixed-use Case Study and Construction Trends at the Mosaic District in Merrifield, VA.” NAIOP Commercial Real Estate Development Association. 2013. Accessed October 30, 2018. https://www.naiop.org/Magazine/2013/Fall-2013/Development-Ownership/The-Mosaic-District.

Neeley, Jonathan. “Topic of the Week: Suburban Retrofits in Our Region.” Greater Greater Washington. April 20, 2015. Accessed October 16, 2018. https://ggwash.org/view/37879/topic-of-the-week-suburban-retrofits-in-our-region.

Pilling, Matthew. “Eric Mumford: The CIAM Discourse on Urbanism 1928-1960 (2002).” Architecture + Urbanism, 31 Mar. 2011, architectureandurbanism.blogspot.com/2011/03/eric-mumford-ciam-discourse-on-urbanism.html.

Polsky, Sara. “The Life and Legacy of Jane Jacobs.” Curbed, Curbed, 4 May 2016, www.curbed.com/2016/5/4/11583092/jane-jacobs-legacy.

Potter, H. C., Schary, D., Panama, N., Frank, M., Grant, C., Loy, M., Douglas, M., ... Turner Entertainment Co. (2004). Mr. Blandings Builds His Dream House. Burbank, CA: Warner Home Video.

Rice, Alison M. “A Suburban Wasteland in Virginia Gets a Modern Urban Feel.” The New York Times. December 18, 2012. Accessed October 30, 2018. https://www.nytimes.com/2012/12/19/realestate/commercial/a-suburban-wasteland-in-virginia-gets-a-modern-urban-feel.html.

Rowe, Colin, and Fred Koetter. “Crisis of the Object: Predicament of Texture.” Collage City, MIT Press, 1984, pp. 50–85. 

Speck, Jeff. Walkable City. New York, NY: Farrar, Straus and Giroux, 2012.

Stephens, Josh. “What If Houston Fell in Love With Planning.” Next City, 9 May 2016, nextcity.org/features/view/houston-flood-deelopment-gentrification.

Stephenson, Bruce. “The Real Cost of Six Million People in a Suburban Swamp.” CNU, 23 June 2016, www.cnu.org/publicsquare/houstons-floods-document-joel-kotkin-s-mypoic-urban-vision.

“Tools.” CNU Congress for the New Urbanism, 17 July 2017, www.cnu.org/resources/tools.

↑Back to Top